Overview
The screening experiment had done its job: nineteen ideas narrowed down to five, and the biggest single influence on response rate by a wide margin was the interest rate advertised. So the chief marketing executive narrowed the question: "now that we know what the envelope should look like — what should the prices be?"
This is the second half of a pair of case studies. The screening design that produced those five survivors is Which of Your Nineteen Good Ideas Actually Works?. Read it for more context, but this case study can stand alone.
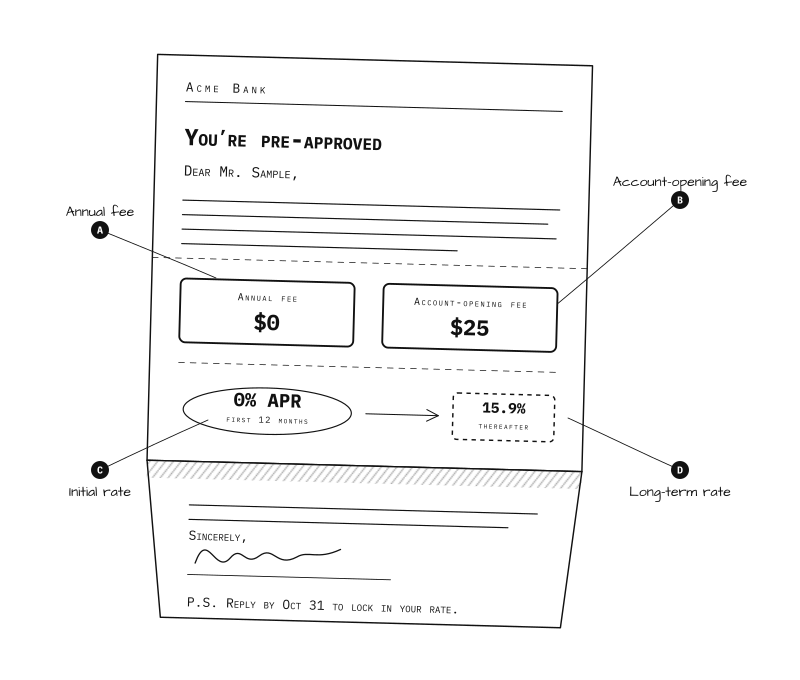
This campaign built on the previous one and examined four specific variables, all of which cost the customer money: the annual fee, an account-opening fee, the introductory interest rate, and the long-term interest rate. Examining the main effects and every combination of them required sixteen test cells, 120,000 prospects, and a single mailing.
The results: the four main effects came back exactly as pricing instinct would predict — charge less and you get more orders. However, the useful part of the experiment was not the main effects — it was how the levers behaved in combination.
The combination of prices that produced the most orders was not the combination that made the most money.
The Challenge
Every one of these four levers reduces revenue per customer. That is what makes pricing tests different from testing a headline in a mailer: there is no free improvement available. A lower fee buys you more customers and less margin on each of them, so the only question left is which combination maximizes profitability.
The team also suspected, correctly, that the variables would not behave independently. A customer weighing an offer does not evaluate the annual fee and the account-opening fee as two separate line items; they form an impression of what the card costs.
One manager argued the opposite case for the opening fee — that charging one might signal exclusivity and help improve response rate. That manager turned out to be not just wrong but expensively wrong: of the four levers tested, the opening fee did more damage to response than any other. Nobody could have known that in advance, and no amount of argument in a conference room was going to settle it. That is exactly the kind of disagreement factorial experimentation was built to resolve — and a properly designed experiment can settle all four of them at once.
The Experimental Approach
The previous screening design also settled which design the follow-up should use.
In Part 1, one of the five main effects was the second buckslip — an extra insert that attempted to explain the offer in more detail, but in practice appeared to reduce orders. A screening design estimates the effect of each idea on its own and deliberately declines to separate the combinations, so what lands in any one column is that idea plus whatever pairings happen to travel with it. The authors later showed that the second buckslip was almost certainly carrying the sticker and the interest rate acting together, not an effect of the insert at all. The screen had done nothing wrong; it had simply reached the edge of what it was built to answer.
Separating those interactions was therefore the goal of the follow-up — and with only four factors left, the classic full factorial is the design that does it.
Four factors at two levels is sixteen combinations — a complete 2⁴ factorial, small enough to run in full. That buys something the screening design could not: all four main effects and all eleven interactions estimated independently, with nothing confounded with anything.
This is the payoff of a technique called sequential experimentation. The screening experiment spent 100,000 prospects to find out which questions were worth asking. The follow-up spends 120,000 answering them completely. Neither design would have answered everything at once. By stepping through experiments, teams can adapt to new knowledge and make the best use of their available resources.
Each of the 16 cells went to 7,500 prospects, 120,000 in total. The four variables were:
- Annual fee (A) — the current fee, or a lower one.
- Account-opening fee (B) — none, or a fee charged to open the account.
- Initial interest rate (C) — the current introductory rate, or a lower one.
- Long-term interest rate (D) — the low rate, or a higher one.
One thing to hold onto before reading any of the numbers below: the levels are not all arranged "cheaper is better." For the annual fee and the initial rate, the second level is the cheaper one. For the account-opening fee the second level adds a charge, and for the long-term rate it raises the rate. So a negative effect on B or D means the customer-friendly setting won — which is the same thing a positive effect on A or C means.
The Design
Sixteen cells mailed in parallel, 7,500 prospects each, response measured as orders placed.
| Run | Std | Annual fee | Account-opening fee | Initial interest rate | Long-term interest rate | Response rate[%] |
|---|---|---|---|---|---|---|
| 1 | 1 | Current | No | Current | Low | 2.4533 |
| 2 | 2 | Lower | No | Current | Low | 3.36 |
| 3 | 3 | Current | Yes | Current | Low | 2.16 |
| 4 | 4 | Lower | Yes | Current | Low | 2.2933 |
| 5 | 5 | Current | No | Lower | Low | 2.4933 |
| 6 | 6 | Lower | No | Lower | Low | 3.3867 |
| 7 | 7 | Current | Yes | Lower | Low | 2.32 |
| 8 | 8 | Lower | Yes | Lower | Low | 2.44 |
| 9 | 9 | Current | No | Current | High | 1.84 |
| 10 | 10 | Lower | No | Current | High | 2.24 |
| 11 | 11 | Current | Yes | Current | High | 1.6933 |
| 12 | 12 | Lower | Yes | Current | High | 1.8667 |
| 13 | 13 | Current | No | Lower | High | 2.2933 |
| 14 | 14 | Lower | No | Lower | High | 2.92 |
| 15 | 15 | Current | Yes | Lower | High | 2.04 |
| 16 | 16 | Lower | Yes | Lower | High | 2.0267 |
16 runs · All ran simultaneously · No run order, so drift cannot confound the result
Because every cell went out at the same time to names drawn from one list, nothing separates the sixteen results except the offer printed on them.
Results & Insights
A complete factorial earns its keep twice over when it follows a screening design. The screening design has already paid for the question — it spent its prospects finding out which four of nineteen ideas were worth a real experiment — so the follow-up does not waste a single cell on a variable that was never going to matter. Everything in these sixteen envelopes is there because the previous twenty earned it a place.
What the complete design adds is the ability to tell a main effect from an interaction. The screen could say how much each idea moved response on its own. This one can say how much each idea moves response given what the other three are doing — which, as it turns out, is a different question with a different answer. Across both experiments that is 36 prototype mailers to settle more than twenty separate arguments about how a credit card offer should look, feel and price. By contrast, nineteen one-at-a-time tests would not have finished the first list, let alone the interactions between variables.
Standard error of an effect: 0.0877 percentage points, so anything outside ±0.172 is significant at 5%. All four main effects clear it, and so does one interaction.
Bottom line
Account-opening fee + Long-term interest rate + Annual fee + Initial interest rate — plus interactions between your factors — together drive 92% of the impact you measured on Response rate.
Analysis of the Variance (ANOVA)
| Factor | Source | Sum of squares | df | Mean square | F | p-value | % of impact | Real effect? |
|---|---|---|---|---|---|---|---|---|
| B | Account-opening fee | 1.07 | 1 | 1.07 | 36.38 | < 0.001 | 30% | Yes |
| D | Long-term interest rate | 0.993 | 1 | 0.993 | 33.63 | < 0.001 | 27% | Yes |
| A | Annual fee | 0.656 | 1 | 0.656 | 22.21 | < 0.001 | 18% | Yes |
| A×B | Annual × Opening | 0.364 | 1 | 0.364 | 12.32 | 0.006 | 10% | Yes |
| C | Initial interest rate | 0.253 | 1 | 0.253 | 8.58 | 0.015 | 7.0% | Yes |
| C×D | Initial × Long-term | 0.100 | 1 | 0.100 | 3.39 | 0.095 | 2.8% | Can't tell from noise |
| A×D | Annual × Long-term | 0.0469 | 1 | 0.0469 | 1.59 | 0.236 | 1.3% | Can't tell from noise |
| B×C×D | Opening × Initial × Long-term | 0.0469 | 1 | 0.0469 | 1.59 | 0.236 | 1.3% | Can't tell from noise |
| B×D | Opening × Long-term | 0.0414 | 1 | 0.0414 | 1.40 | 0.264 | 1.1% | Can't tell from noise |
| A×B×D | Annual × Opening × Long-term | 0.0289 | 1 | 0.0289 | 0.980 | 0.346 | 0.8% | Can't tell from noise |
| A×B×C | Annual × Opening × Initial | 0.0107 | 1 | 0.0107 | 0.360 | 0.561 | 0.3% | Can't tell from noise |
| A×B×C×D | All four factors | 0.0107 | 1 | 0.0107 | 0.360 | 0.561 | 0.3% | Can't tell from noise |
| B×C | Opening × Initial | 0.00930 | 1 | 0.00930 | 0.320 | 0.586 | 0.3% | Can't tell from noise |
| A×C×D | Annual × Initial × Long-term | 0.000300 | 1 | 0.000300 | 0.0100 | 0.925 | 0.0% | Can't tell from noise |
| A×C | Annual × Initial | 0 | 1 | 0 | 0 | 0.985 | 0.0% | Can't tell from noise |
| Error (noise) | 0.295 | 10 | 0.0295 | |||||
| Total | 3.64 | 15 | ||||||
α = 0.05 · average response = 2.36 · 16 runs
The two interactions worth looking at are below. An interaction plot is read by slope: parallel lines mean the two levers act independently and can be decided separately, and lines that diverge mean they cannot.
- no opening fee
- opening fee charged
- long-term rate low
- long-term rate high
Each point averages the four cells at that combination. Bars show the 95% interval, ±0.172 percentage points. Parallel lines would mean the two levers act independently.
The fees compound. With an account-opening fee charged, lowering the annual fee moves response from 2.05% to 2.16% — almost nothing. With no account-opening fee, the same reduction moves response from 2.27% to 2.98%. The best cell in the whole experiment is a lower annual fee with no opening fee, and it beats what you would predict by adding the two effects separately. One plausible reading: an opening fee triggers an immediate rejection, and nothing you do downstream of that recovers the customer.
The discount only lands when the base rate is bad. When the long-term rate is already low, cutting the introductory rate moves response from 2.57% to 2.66%. When the long-term rate is high, the same cut moves it from 1.91% to 2.32%. The conclusion: a teaser rate is worth something only when the rate it leads to is unattractive. If the long-term offer is already good, the introductory discount is money given away for nothing.
That second pattern comes with a caveat the original authors were careful to state, and we will repeat it rather than round it off. The initial-by-long-term interaction is estimated at 0.158, against a significance threshold of 0.172 — just below the threshold. The paper notes exactly this. The pattern is real enough to act on in the next experiment and not yet strong enough to call settled.
And then the part that makes this case study. The firm ran these results through its own profitability models and found that the most profitable combination was not the one that resulted in the most orders. A lower long-term rate paired with the current, higher initial rate beat the combination that maximized response. On the fee side it went the other way — dropping the opening fee and lowering the annual fee produced more new business than the fee revenue it gave up. Response rate was the thing they could measure, but it was not the thing they were optimizing.
Key Takeaways
- The offer that wins the most customers is not automatically the offer you should make. The highest-response combination lost to a different one once margin was priced in — and you can only see that if the experiment gives you the whole response surface instead of one winner.
- Two fees are not two decisions. Lowering the annual fee bought 0.10 points with an opening fee in place and 0.71 points without one. Testing them separately would have given two true answers and one wrong conclusion.
- First screen the ideas, then resolve them. Twenty prototype mailers reduced nineteen ideas to five; sixteen more answered four of them completely. Neither design could have done the other's job.
Source. Bell, G.H., Ledolter, J., & Swersey, A.J. (2006). Experimental design on the front lines of marketing: Testing new ideas to increase direct mail sales. International Journal of Research in Marketing, 23(3), 309–319. doi:10.1016/j.ijresmar.2006.05.002. Every response rate is the original; the company name and proprietary details were removed by the authors. The Blueprint recreation, the analysis framing and the plain-English reading of the results are original WIS work.