Stop guessing your way toward innovation.Start making decisions with confidence.
Good ideas aren’t enough to accelerate innovation. You need to know what will actually work. We help you get the proof you need efficiently, so you can make evidence-based decisions while factoring in the things that really matter.
Your decisions need evidence. Getting that evidence efficiently is the problem.
You were taught to experiment in the least efficient way.That method has a price: wasted effort, lost time, and stalled momentum.
Most businesses still test the way we were all taught: change one variable, hold the rest steady, measure, move to the next. It’s the beginner’s version: a slow, inefficient approach that wastes valuable resources, especially time. What’s worse, that type of experiment misses an entire category of evidence it structurally cannot find: what happens when two of those things move together.
It’s why your best result was never repeatable.
Poorly structured experiments produce even worse data, resulting in high-risk scenarios that decision-makers have to act upon. Leaders are asked to shoulder that risk without the evidence to justify it and, worse yet, without the confidence to lead the team behind them. After a while these forces take hold: creativity starves, momentum stalls, and businesses miss the breakthroughs that could define their competitive edge.
It doesn’t have to be this way. There is a better approach and a proven method.
Resource Waste Estimator
What is your testing method costing you?
What kind of test are you about to run?
Three questions about your own process
Three ways to get an answer
- Answers all 21 questions, no assumptions required
- 100 years of runs · 15,625 runs
- Statistically unverified — no way to separate a real effect from noise
- One more variable and the whole thing multiplies by 5 again
- Simple to run · 25 runs, 5 settings each
- Can’t see combinations — none of the 15, at any number of runs
- No prediction model — just a list of separate results
- The ranking changes depending on where you started
- Ranks all 6 from one design — 8 runs whether you have 4 variables or 7
- Every run informs every variable — 4× the information per estimate
- Tells you what to stop testing
- Combinations — that’s what the next design is for
Show the plan
A fractional 2^(6−3) at two settings per variable: 8 runs, every one of them contributing to every variable’s estimate. You come out with the 3 or so worth keeping and a list of what to stop testing. Screening always uses 2 settings per variable — the settings slider above describes how you’d sweep them one at a time instead.
Industry leaders have been using this proven method to innovate over a century.
This structured methodology took a team of specialists.
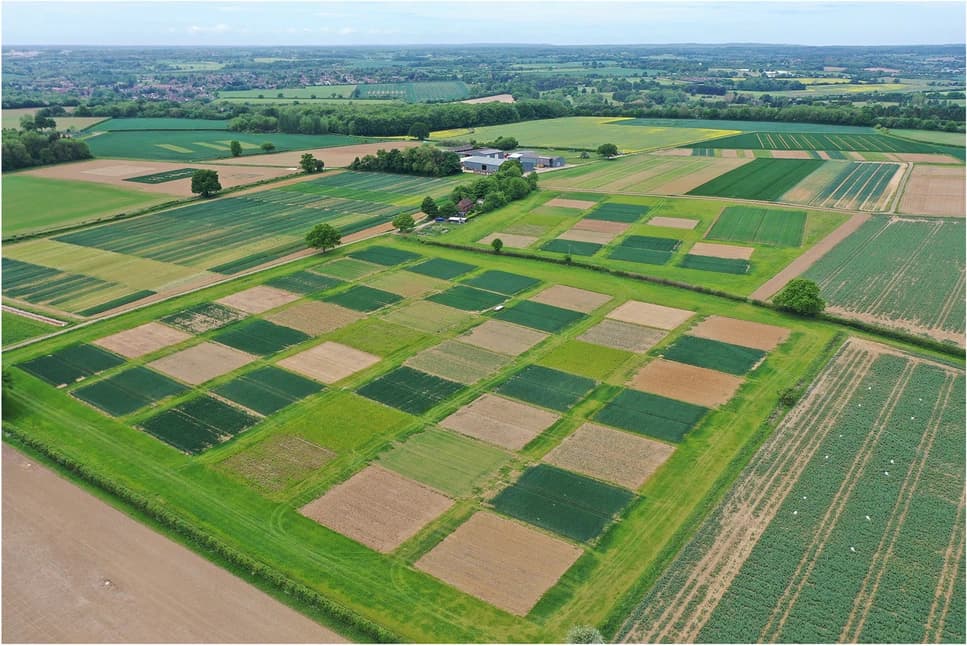
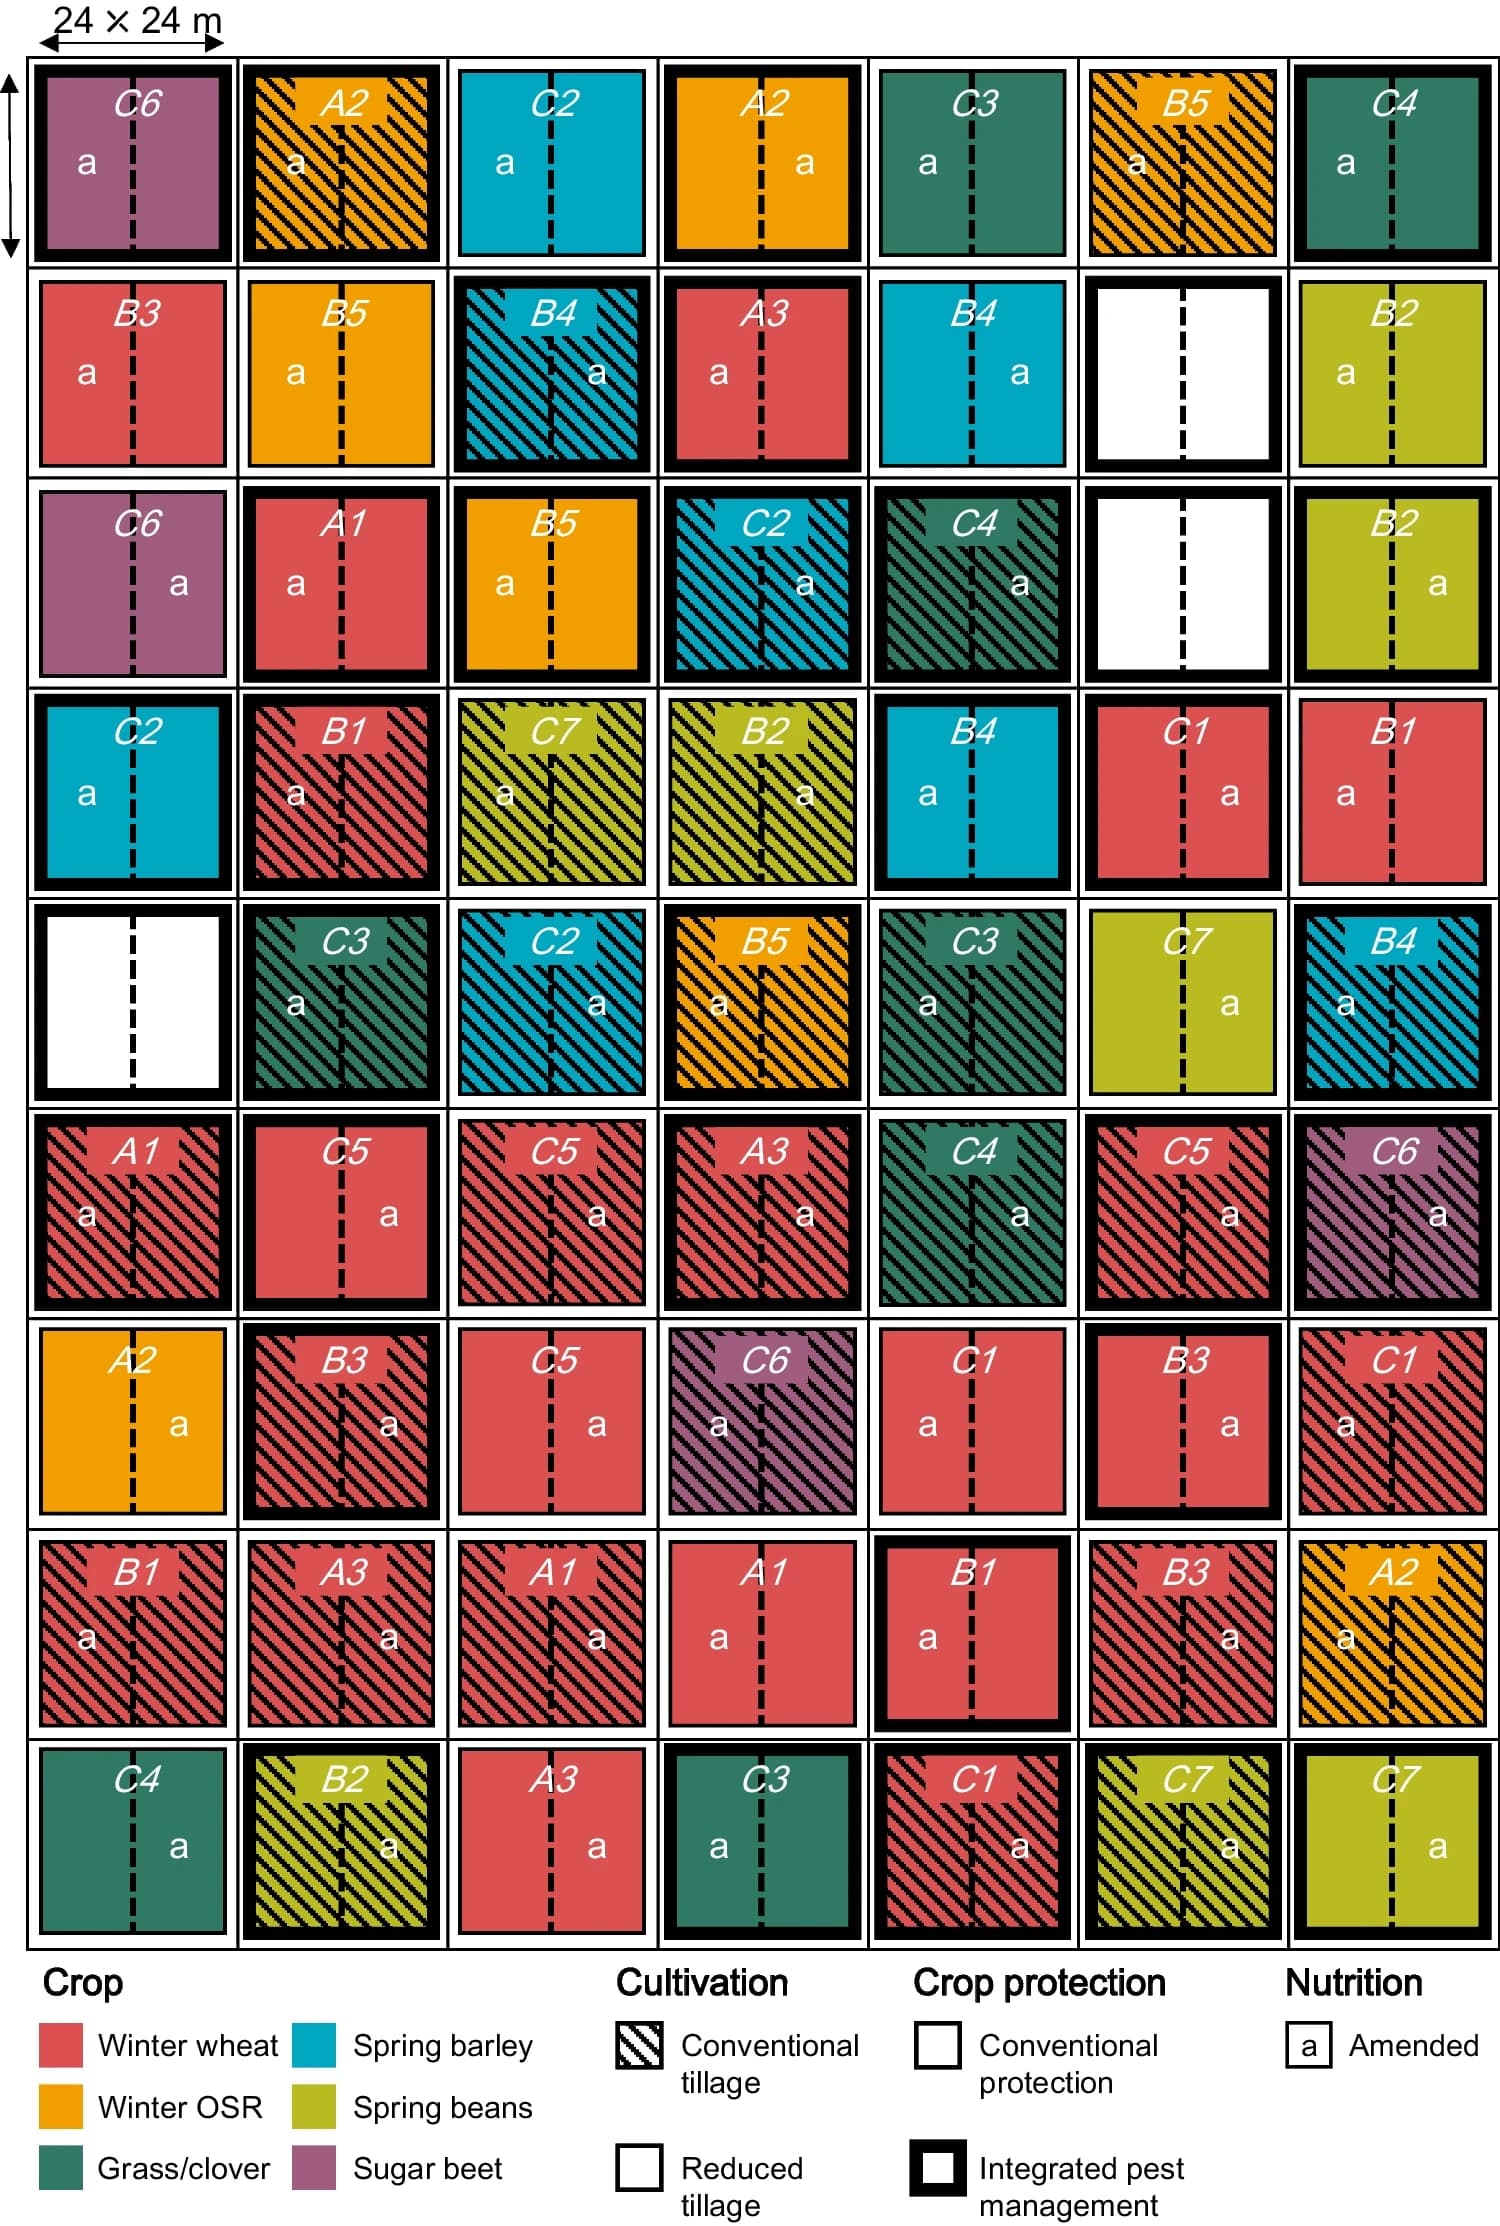
Factorial experimentation, the structured methodology developed by Ronald Fisher in the 1920s, was first used on an English farm, settling a long-standing debate about which fertilizers actually mattered. Instead of speculation, Fisher used math. And serious manufacturers and business operators have been using it efficiently in their own industries ever since. The method allows innovators to say we know, instead of we think.
So why has nobody offered it to you?
Because the entry price was expensive, and you needed at least a statistician to design the thing properly, a process engineer to run it without spoiling it, and a data scientist to read what came back—all amounting to a six-figure expense before the experiment even began. Not to mention the five-figure software for the three of them to share.
You don’t have to become any of those people.
While the method has enjoyed a century of success stories, it remained cloistered behind academia and sheltered behind companies with large enough pockets to swallow the expense…until now.
We’ve removed the barrier to entry.It’s time to innovate.
Warner Innovation Systems has turned the genius of factorial experimentation into a procedure designed for your company.
Welcome to a structured, results-driven experiment for any process, at any size.
We exist for businesses that want to improve and innovate but don’t know where to start.
We don’t just hand you complicated math equations. We offer a step-by-step procedure — a sequence of decisions about what to change, when, and in what combination — resulting in maximum efficiency and innovative success.
You won’t end up with a bunch of statistical jargon. You finish with the kind of clear and concise results you are excited to present in a meeting — the kind of data that launches you forward.
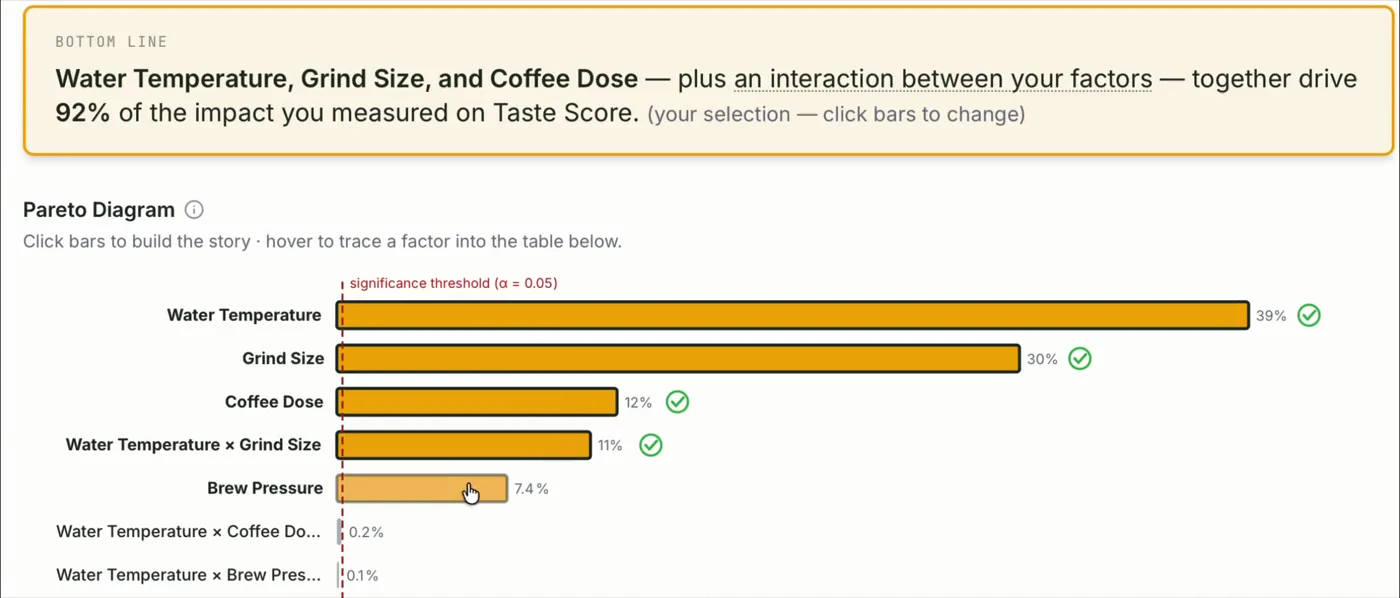
Looking at this experiment, you’d be able to say with confidence: “Water temperature, grind size and coffee dose — plus an interaction between two of them — drive 92% of the impact on taste score, so that’s where we are putting our focus right now.” You have achieved sensible, defensible proof, and the details behind it to drive your team’s next steps.
- 01DEFINEMap every possible cause.
- 02CLASSIFYClassify every factor.
- 03SIZEInnovation on budget.
- 04LOCKProcedures generated. Constants locked.
- 05RUNExecute with confidence.
- 06REVEALResults built for the room.
Organizations that have put this to work







If you’ve ever thought: “I think thesevariables affect our yield — butI just don’t know which or by how much.”
That’s the problem we solve.
To help you start, which of these describes you?
Innovation is a method, not a miracle.