Overview
A Fortune 500 financial products company mailed credit card offers by the hundreds of thousands. Its marketing group had nineteen separate ideas for increasing the response rate on that package — a sticker on the letter, a different headline, a second insert, a lower interest rate, a dozen others — and each idea had an advocate willing to fight for it.
The standard way to settle that is to test the ideas one at a time against a control. That means nineteen ideas, nineteen cycles, and — at the sample size needed to detect a difference worth having — 475,000 prospects.
Instead, using a highly efficient structured experimentation technique, the marketing team tested all nineteen variables simultaneously in twenty envelope designs and 100,000 prospects. They came out with clear evidence that five variables were worth caring about for the mailer design, and fourteen that were never going to matter.
Before the mailing, all nineteen were opinions. After it, five were facts.
The Challenge
Direct mail has an unusual property for a marketing channel: the result is unambiguous. Someone responds or they do not. That makes it testable in a way most advertising is not, and the industry has known this for a century — "test everything" is the oldest advice in the business.
The problem is not willingness to test — it’s the method by which the ideas get tested. The firm's creative and marketing teams had nineteen credible ideas and the conventional method — change one thing → mail it against the control → wait → read the result — handles exactly one idea per cycle. Nineteen cycles tested this way take a tremendous amount of time and burn through a finite list of names.
Worse yet, one-idea-at-a-time testing is underpowered. The firm's baseline response rate was about 1%. A change worth having might move that to 1.2%. Detecting a shift that small, reliably, takes tens of thousands of prospects per test. Split the available 100,000 names across nineteen one-at-a-time tests and each one gets roughly 5,000 — which gives about a 30% chance of noticing a real improvement. Seven times out of ten you would mail a genuinely better package, see nothing in the results, and discard the idea.
The issue was clear: the conventional “test one idea at a time” approach is too lengthy, uses too many resources, and underperforms. The answer: a properly structured, highly efficient experimental design that takes a fraction of the time and effort and provides statistically useful information.
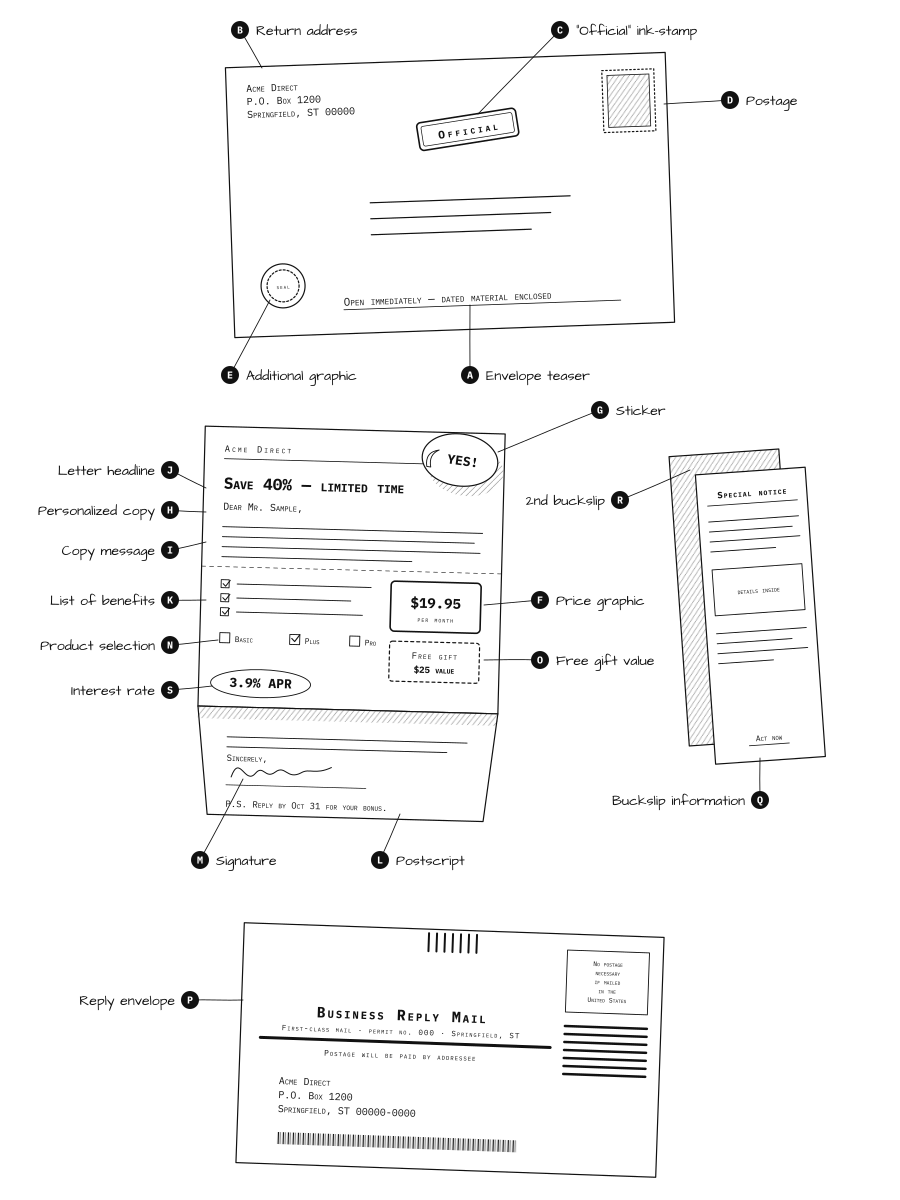
The nineteen ideas on the table touched every part of the package, lettered here as they appear on the drawing below:
- Envelope teaser (A) — a general offer line, or one naming the product.
- Return address (B) — blind, or carrying the company name.
- "Official" ink-stamp (C) — the stamp that makes the envelope look like business correspondence, or no stamp.
- Postage (D) — pre-printed indicia, or a real stamp.
- Additional graphic (E) — a second image on the outer envelope, or none.
- Price graphic (F) — small, or enlarged on the letter.
- Sticker (G) — a peel-off sticker the reader moves to the order form, or none.
- Personalized copy (H) — a generic salutation, or the reader's own details worked into the letter.
- Copy message (I) — targeted to the reader's inferred interests, or generic.
- Letter headline (J) — two competing headlines.
- List of benefits (K) — a standard layout, or a creative one.
- Postscript (L) — the existing P.S., or a new one.
- Signature (M) — signed by a manager, or by a senior executive.
- Product selection (N) — many options presented, or a few.
- Free gift value (O) — a higher-value gift, or a lower-value one.
- Reply envelope (P) — the current reply envelope, or a new style.
- Buckslip information (Q) — product details, or free gift details.
- 2nd buckslip (R) — adding a second insert, or not.
- Interest rate (S) — the rate printed on the offer.
The Experimental Approach
With nineteen factors at two levels each, a complete factorial that tests all combinations is 219 — 524,288 trials, which is simply not realistic. Even a fractional factorial needs a run count that is a power of two, so the smallest usable fraction for nineteen factors is 32 trials.
A Plackett–Burman design, however, does it in 20 trials. PB designs exist at every multiple of four, which is what lets them land between the powers of two, and they are built to do one job: estimate the main effect of every factor, cleanly and independently, while deliberately declining to resolve the interactions between them. The idea is this: it is extremely unlikely that all the variables in question have a statistically significant effect on the response rate. By estimating only the main effects, the team can separate the “trivial many” from the “important few.” That not only helps them determine where to put their focus, but also gives them the exact information necessary to perform a follow-up experiment and tease out any interactions that were previously ignored. That method — stepping through experiments in sequence, on purpose, and gaining new information at each stage — has a name: sequential experimentation.
That is the trade, and at this stage it is the right one. The team was not trying to model the campaign. They were trying to find out which of nineteen ideas deserved a follow-up experiment.
Each of the 20 prototype offer designs went to 5,000 people, for 100,000 in total, with a further 400,000 receiving the existing control package in parallel. Because the design is orthogonal, every factor's effect is estimated from a comparison of 50,000 against 50,000 — the same 100,000 people doing nineteen jobs at once.
Said another way: statistical power is the chance an experiment notices a real effect when one exists. This design runs at 86–92%. Testing one idea at a time, with the same hundred thousand names, runs at about 30% — meaning seven out of ten real improvements would have been mailed, measured, and thrown away. How you design the experiment has consequences before you collect a single response.
The nineteen ideas were the only things allowed to move. Everything else had to be held still, or the comparison would not have been a comparison. Five things were fixed for the whole experiment:
- All twenty designs were mailed on the same day, alongside the control, so no cell caught a better week than another.
- Names came from one list, assigned to cells at random rather than by region, tenure or any other characteristic.
- Every cell got exactly 5,000 prospects, which is what makes the twenty response rates directly comparable.
- The existing package ran in parallel at 400,000 pieces, as a live benchmark rather than a remembered one.
- Orders were counted over the same window for every cell, so a slow responder in one cell was not a non-responder in another.
The Design
20 test cells mailed in parallel, 5,000 prospects per cell, against a 400,000-piece control running at the same time. Response measured as orders placed.
| Run | Std | Envelope teaser | Return address | "Official" ink-stamp | Postage | Additional graphic | Price graphic | Sticker | Personalized copy | Copy message | Letter headline | List of benefits | Postscript | Signature | Product selection | Free gift value | Reply envelope | Buckslip information | 2nd buckslip | Interest rate | Response rate[%] |
|---|---|---|---|---|---|---|---|---|---|---|---|---|---|---|---|---|---|---|---|---|---|
| 1 | 1 | Product-specific | Add company name | Yes | Pre-printed | No | Large | No | Yes | Targeted | Headline 2 | Standard layout | New P.S. | Manager | Many | High | Control | Free gift info | Yes | Low | 1.04 |
| 2 | 2 | General offer | Add company name | No | Pre-printed | Yes | Large | No | Yes | Generic | Headline 1 | Creative layout | Control version | Senior executive | Many | High | Control | Product info | Yes | High | 0.76 |
| 3 | 3 | Product-specific | Blind | No | Stamp | Yes | Small | No | Yes | Generic | Headline 2 | Standard layout | New P.S. | Manager | Few | High | Control | Product info | No | High | 0.84 |
| 4 | 4 | Product-specific | Add company name | Yes | Stamp | No | Small | Yes | Yes | Generic | Headline 2 | Creative layout | Control version | Senior executive | Many | Low | Control | Product info | No | Low | 2.68 |
| 5 | 5 | General offer | Add company name | No | Pre-printed | No | Large | Yes | No | Generic | Headline 2 | Creative layout | New P.S. | Manager | Few | High | New style | Product info | No | Low | 2.08 |
| 6 | 6 | General offer | Blind | No | Stamp | Yes | Large | No | No | Targeted | Headline 2 | Creative layout | New P.S. | Senior executive | Many | Low | Control | Free gift info | No | Low | 1.2 |
| 7 | 7 | General offer | Blind | Yes | Stamp | No | Small | No | Yes | Targeted | Headline 1 | Creative layout | New P.S. | Senior executive | Few | High | New style | Product info | Yes | Low | 1.22 |
| 8 | 8 | General offer | Blind | Yes | Pre-printed | No | Large | Yes | Yes | Generic | Headline 1 | Standard layout | New P.S. | Senior executive | Few | Low | Control | Free gift info | No | High | 1.36 |
| 9 | 9 | Product-specific | Blind | Yes | Pre-printed | Yes | Large | No | No | Generic | Headline 2 | Standard layout | Control version | Senior executive | Few | Low | New style | Product info | Yes | Low | 1.14 |
| 10 | 10 | General offer | Add company name | Yes | Pre-printed | Yes | Small | No | Yes | Targeted | Headline 2 | Creative layout | Control version | Manager | Few | Low | New style | Free gift info | No | High | 0.6 |
| 11 | 11 | Product-specific | Blind | No | Pre-printed | Yes | Small | Yes | Yes | Generic | Headline 1 | Creative layout | New P.S. | Manager | Many | Low | New style | Free gift info | Yes | Low | 2.16 |
| 12 | 12 | General offer | Add company name | Yes | Stamp | Yes | Small | Yes | No | Generic | Headline 2 | Standard layout | New P.S. | Senior executive | Many | High | New style | Free gift info | Yes | High | 0.78 |
| 13 | 13 | Product-specific | Blind | No | Pre-printed | No | Small | Yes | No | Targeted | Headline 2 | Creative layout | Control version | Senior executive | Few | High | Control | Free gift info | Yes | High | 0.8 |
| 14 | 14 | Product-specific | Add company name | Yes | Stamp | Yes | Large | Yes | No | Targeted | Headline 1 | Creative layout | New P.S. | Manager | Few | Low | Control | Product info | Yes | High | 0.98 |
| 15 | 15 | Product-specific | Add company name | No | Pre-printed | No | Small | No | No | Targeted | Headline 1 | Standard layout | New P.S. | Senior executive | Many | Low | New style | Product info | No | High | 0.74 |
| 16 | 16 | Product-specific | Add company name | No | Stamp | Yes | Large | Yes | Yes | Targeted | Headline 1 | Standard layout | Control version | Senior executive | Few | High | New style | Free gift info | No | Low | 1.98 |
| 17 | 17 | General offer | Add company name | No | Stamp | No | Small | No | No | Generic | Headline 1 | Standard layout | Control version | Manager | Few | Low | Control | Free gift info | Yes | Low | 1.72 |
| 18 | 18 | General offer | Blind | No | Stamp | No | Large | Yes | Yes | Targeted | Headline 2 | Standard layout | Control version | Manager | Many | Low | New style | Product info | Yes | High | 0.86 |
| 19 | 19 | Product-specific | Blind | Yes | Stamp | No | Large | No | No | Generic | Headline 1 | Creative layout | Control version | Manager | Many | High | New style | Free gift info | No | High | 0.94 |
| 20 | 20 | General offer | Blind | Yes | Pre-printed | Yes | Small | Yes | No | Targeted | Headline 1 | Standard layout | Control version | Manager | Many | High | Control | Product info | No | Low | 2.08 |
20 runs · All ran simultaneously · No run order, so drift cannot confound the result
Results & Insights
A screening design buys its efficiency by declining to separate the effect of one change from the effect of certain combinations of changes. Every number in the table is the effect of a single idea plus whatever pairings happen to ride along with it in this design. Most of the time that is harmless. Occasionally it is not, meaning an idea looks important only because it is carrying something else.
So the honest reading of this experiment is not “here are the five winners.” It is “here are the fourteen that are not, and the five that have earned a real experiment.” That distinction is where the value sits. Fourteen ideas came off the table on evidence instead of argument, and the team’s attention narrowed to five variables it could now afford to study properly — which is exactly what Part 2 of this case study does.
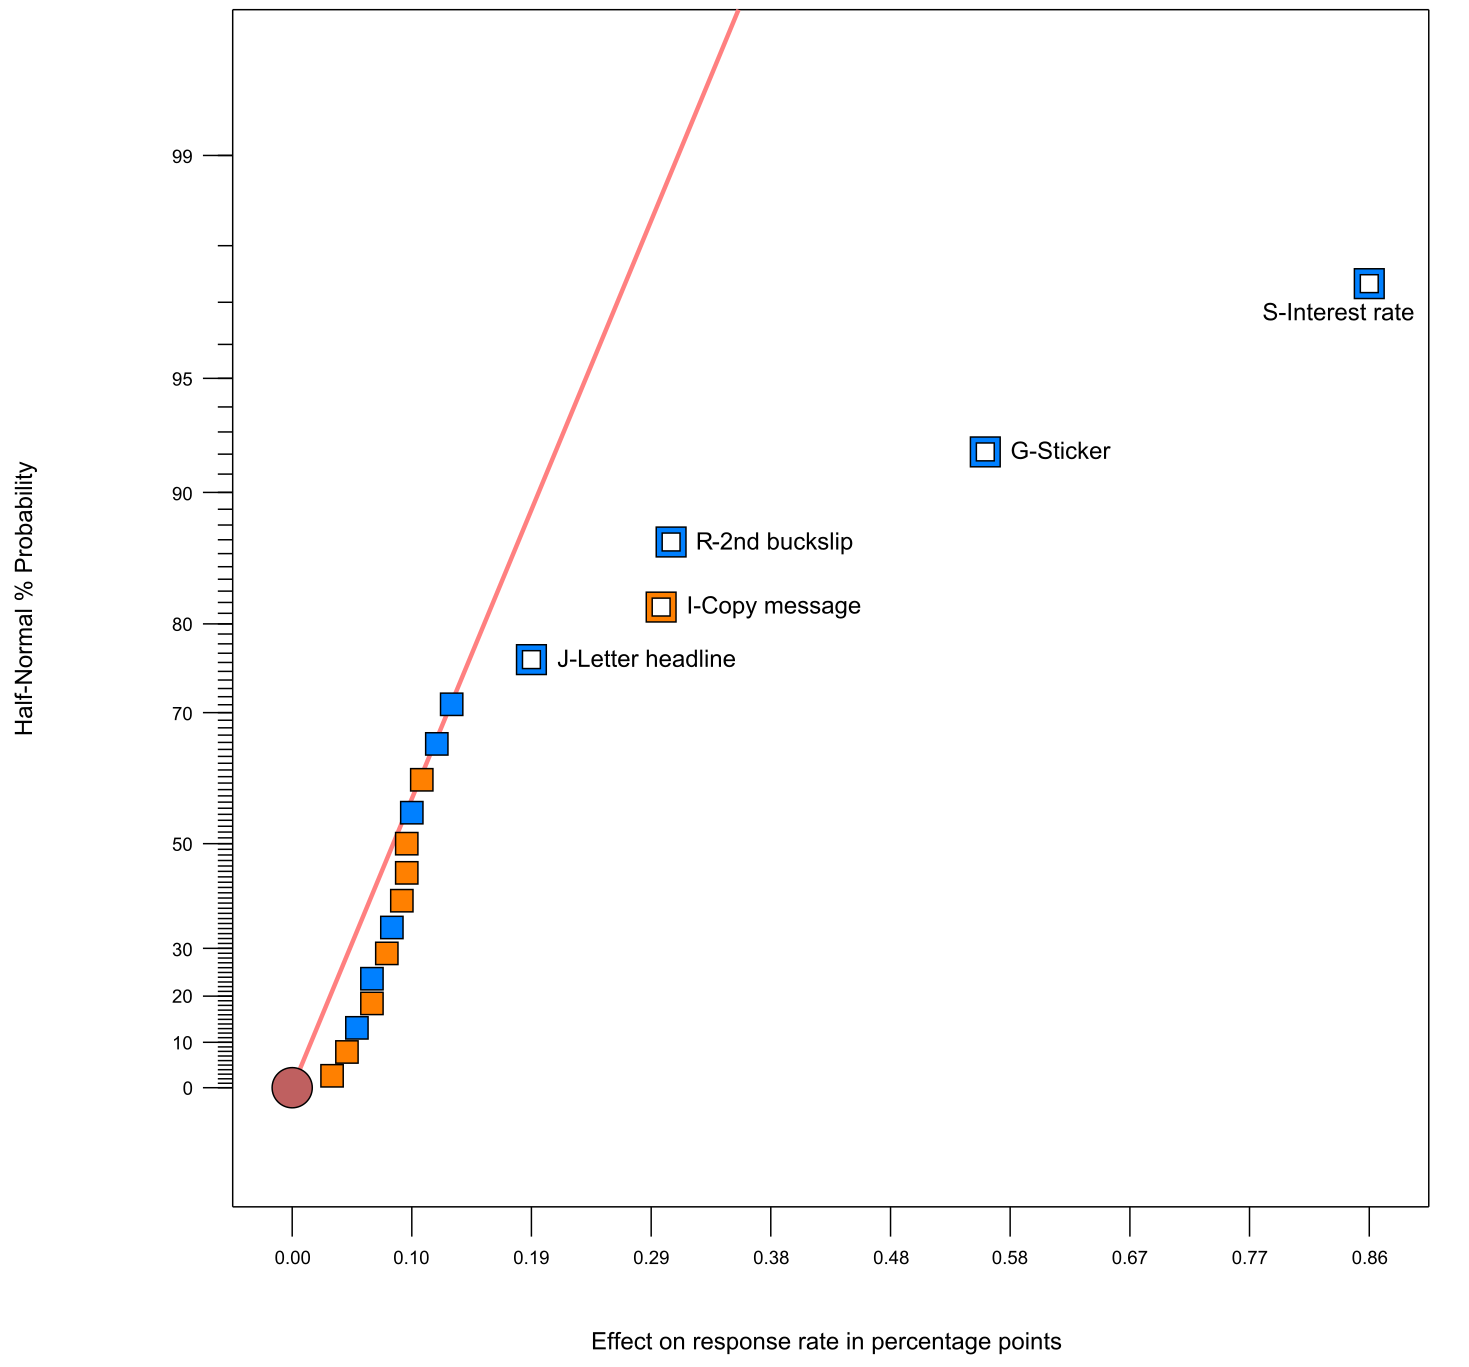
The standard error of an estimated effect is 0.072 percentage points, so any effect bigger than ±0.141 clears the 5% significance threshold.
Practically speaking, a 5% significance threshold means a factor that truly does nothing would have to get unusually lucky — a one-in-twenty fluke — to throw a number that large. Four of the five clear the line by a wide margin. The fifth, the letter headline at 0.192, sits close enough to it that it has earned a follow-up experiment rather than a decision.
Five factors cleared the threshold:
| Factor | Effect | Better setting | p-value | |
|---|---|---|---|---|
| Interest rate | −0.864 | Low rate | < 0.001 | |
| Sticker | −0.556 | Keep the sticker | < 0.001 | |
| 2nd buckslip | −0.304 | No 2nd buckslip | < 0.001 | |
| Copy message | +0.296 | Generic copy | < 0.001 | |
| Letter headline | −0.192 | Headline 1 | 0.007 | |
| the other 14 — inside the noise band | ||||
| Price graphic | −0.128 | 0.074 | ||
| Postscript | −0.116 | 0.105 | ||
| Personalized copy | +0.104 | 0.146 | ||
| Reply envelope | −0.096 | 0.180 | ||
| Additional graphic | +0.092 | 0.199 | ||
| Free gift value | +0.092 | 0.199 | ||
| List of benefits | +0.088 | 0.219 | ||
| Buckslip information | −0.080 | 0.264 | ||
| Return address | +0.076 | 0.288 | ||
| Envelope teaser | +0.064 | 0.371 | ||
| Signature | −0.064 | 0.371 | ||
| Product selection | −0.052 | 0.468 | ||
| Postage | +0.044 | 0.539 | ||
| "Official" ink-stamp | +0.032 | 0.655 | ||
| −1.0−0.50+0.5+1.0 | ||||
← the existing package was betterthe new idea was better →
clears ±0.141inside the noise bandthe ±0.141 noise bandeffect on response rate, percentage points
The remaining fourteen all fall between −0.128% and +0.104% — inside the noise band, and inside it by a wide margin. That is just as important as knowing which ones do matter. No more guessing — just results.
Effect sizes tell you which levers move the needle. Interestingly, three of these five factors did something even more useful than that — they contradicted a set of beliefs the group had been assuming for years and quietly shaped the package they had been using.
Here are the unexpected findings regarding marketing mailers:
- The generic message beat the targeted one. The creative team was certain that appealing to a customer's specific interests would increase response. It did the opposite, by 0.296 points. This is the single most quotable result in the study.
- The sticker is nearly free and worth 0.556 points. A peel-off sticker the customer moves to the order form. Cost per piece is trivial against the gain.
- The second buckslip hurt. Adding more information reduced orders. One reading is that it obscured a simple offer — but the authors later show it is probably not a main effect at all, which is where Part 2's thread starts.
In business terms, here’s the ROI for this type of screening design:
- 19 ideas resolved in one mailing cycle, not nineteen - dramatically shortening the duration to get results.
- 100,000 prospects, versus 475,000 for one-at-a-time testing at the same statistical power - keeping leads intact for future growth.
- Detection power 0.86–0.92, versus 0.29–0.32 for the one-at-a-time alternative at the same total sample size - this design dramtically overperforms the conventional understanding.
- Predicted response for the best combination: 2.40%, a 15% lift over the 2.1% control.
- Fourteen ideas permanently off the agenda, decided based on evidence.
Key Takeaways
- Testing nineteen ideas at once cost less than testing one. Running them one at a time, at the sample size needed to actually see a result, would have taken 375,000 more prospects than testing all nineteen together.
- An underpowered test is worse than no test. At one-at-a-time sample sizes the campaign had roughly a 30% chance of detecting a real improvement — meaning good ideas get discarded as failures seven times in ten.
- Fourteen of nineteen ideas did nothing, and knowing that is worth as much as knowing which five did. The creative team stopped arguing about postage, signatures and envelope graphics.
- The expert consensus was wrong about the most expensive idea. Everyone knew targeted copy would beat generic copy. It lost by 0.296 percentage points.
Source. Bell, G.H., Ledolter, J., & Swersey, A.J. (2006). Experimental design on the front lines of marketing: Testing new ideas to increase direct mail sales. International Journal of Research in Marketing, 23(3), 309–319. doi:10.1016/j.ijresmar.2006.05.002. Every response rate and all nineteen effect estimates are the original; the company name and proprietary details were removed by the authors. The Blueprint recreation, the analysis framing and the plain-English reading of the results are original WIS work.