Overview
A consumer product design team for a new household vacuum could explain why each one of seven different variables should affect how much dirt the machine lifts out of a carpet. What they could not do was rank them — and with seven variables interacting inside one rotating brush roller, arguing about it was never going to settle anything.
The team tested twelve configurations using a highly efficient screening design — seven variables in twelve runs, plus replicates. That settled it. Two variables carried 92.5% of the variation in vacuum performance: how many tufts sit on the roller, and how thick each tuft is. Three of the seven did essentially nothing. A fourth was kept for a reason the statistics could not supply, and a fifth was set aside for one.
Screening designs let a product team find out what matters before committing to what to build. Two of seven variables produced 92.5% of the variation in how this vacuum performs — exactly what the team needed to know, and roughly a tenth of the work a complete experiment would have cost.
What follows is the screening half of a two-part study: how seven candidates became a shortlist of three, and what it cost to find out.
The Challenge
The design of every consumer product is a tradeoff between cost, features and quality: make the product clean better and it costs more; make it cheaper and quality can suffer. Most teams resolve that argument the same way — someone senior decides, and the decision is defended with experience rather than evidence.
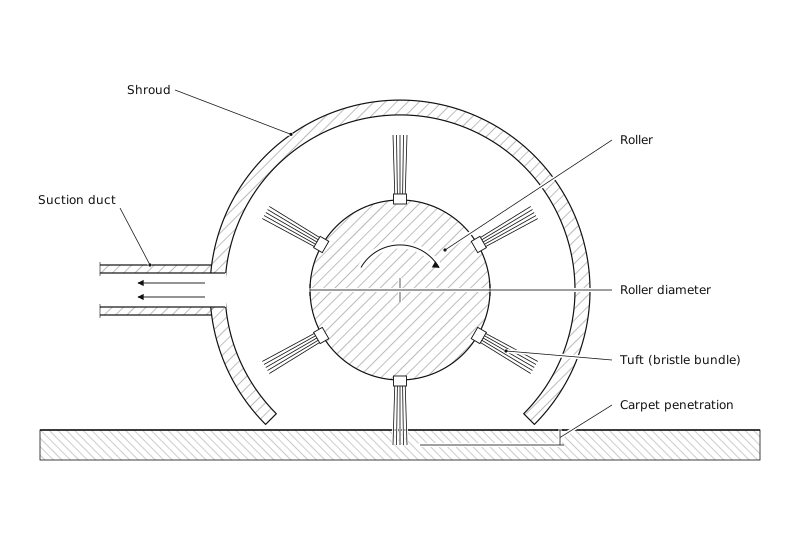
Modern products make this harder rather than easier. A vacuum's brush roller looks like a single part, but it behaves like a system: a core, bristles set into it, a speed it turns at, a depth it reaches. Change one and you have quietly changed what the others do. Testing by intuition, one variable at a time, does not survive scrutiny — someone inevitably asks the right question: by changing one variable, how do you know you haven't affected the others?
So the team listed everything they believed mattered, and settled on seven variables to study:
- Core diameter — the thickness of the cylinder the bristles mount into.
- Tuft diameter — how thick each bundle of bristles is.
- Bristle pattern — whether the tufts spiral around the core in one start or two.
- Brush RPM — how fast the roller turns.
- Number of tufts — how many bundles are set into the core.
- Filament diameter — the thickness of a single bristle.
- Carpet penetration — how far the bristles reach into the pile.
Every one of those has a story attached, which is precisely the problem. Seven credible variables is seven arguments with no clear answer. Testing them one at a time would take dozens of builds and still miss anything that only appears in combination. What the team needed first was not an optimum. It was a shortlist.
The Experimental Approach
Screening designs exist for exactly this moment: many candidate variables, no idea which ones matter, and no appetite yet for the cost of finding out precisely.
A complete factorial across seven variables at two levels each is 2⁷ — 128 builds. The team ran twelve configurations instead, using a Taguchi L12 array. The L12 is the twelve-run Plackett–Burman design: it spends its runs estimating the seven main effects cleanly and deliberately declines to resolve the interactions between them. That is the trade, and at this stage it is the right one. You are not trying to model the system yet. You are trying to find out which variables are worth modeling.
Inputs · variables tested
Core Diameter
25 mm → 34 mm
Tuft Diameter
2 mm → 4 mm
Bristle Pattern
1 start → 2 start
Brush RPM
3,000 rpm → 4,000 rpm
No. of Tufts
66 → 86
Filament Diameter
0.2 mm → 0.4 mm
Carpet Penetration
2 mm → 4 mm
Process
Carpet pickup
Outputs · what we measured
Response
Pickup [%]
The prototype was built so all seven variables could be changed on one rig, which is what makes twelve configurations possible at all — otherwise every row of the design is a new tool.
Each configuration was then run four times, for 48 runs in total. Replication is not free, but here it was close to it: soiling a test carpet and running the prototype takes a few minutes. The team felt the experiment could be substantially strengthened with replicates and the runs were cheap, so they bought precision instead of saving time. That decision turned out to matter.
The Design
Forty-eight runs — twelve distinct configurations, each repeated four times — with the response measured as pickup: the percentage of test soil lifted from the carpet in a single pass.
| Run | Std | Core Diameter(mm) | Tuft Diameter(mm) | Bristle Pattern(start) | Brush RPM(rpm) | No. of Tufts | Filament Diameter(mm) | Carpet Penetration(mm) | Pickup[%] |
|---|---|---|---|---|---|---|---|---|---|
| 1 | 1 | 25 mm | 2 mm | 1 start | 3,000 rpm | 66 | 0.4 mm | 4 mm | 56.2 |
| 2 | 2 | 25 mm | 4 mm | 1 start | 4,000 rpm | 86 | 0.2 mm | 4 mm | 53 |
| 3 | 3 | 25 mm | 2 mm | 2 start | 4,000 rpm | 86 | 0.2 mm | 2 mm | 72.9 |
| 4 | 4 | 25 mm | 2 mm | 1 start | 3,000 rpm | 66 | 0.2 mm | 2 mm | 47.6 |
| 5 | 5 | 34 mm | 2 mm | 2 start | 3,000 rpm | 86 | 0.4 mm | 4 mm | 83.9 |
| 6 | 6 | 34 mm | 2 mm | 2 start | 4,000 rpm | 66 | 0.2 mm | 4 mm | 53.6 |
| 7 | 7 | 25 mm | 4 mm | 2 start | 4,000 rpm | 66 | 0.4 mm | 4 mm | 34.5 |
| 8 | 8 | 34 mm | 4 mm | 1 start | 3,000 rpm | 86 | 0.2 mm | 4 mm | 55.2 |
| 9 | 9 | 34 mm | 4 mm | 1 start | 4,000 rpm | 66 | 0.4 mm | 2 mm | 38.7 |
| 10 | 10 | 25 mm | 4 mm | 2 start | 3,000 rpm | 86 | 0.4 mm | 2 mm | 57.3 |
| 11 | 11 | 34 mm | 4 mm | 2 start | 3,000 rpm | 66 | 0.2 mm | 2 mm | 37.2 |
| 12 | 12 | 34 mm | 2 mm | 1 start | 4,000 rpm | 86 | 0.4 mm | 2 mm | 85.8 |
| 13 | 4 | 25 mm | 2 mm | 1 start | 3,000 rpm | 66 | 0.2 mm | 2 mm | 50 |
| 14 | 1 | 25 mm | 2 mm | 1 start | 3,000 rpm | 66 | 0.4 mm | 4 mm | 55.7 |
| 15 | 3 | 25 mm | 2 mm | 2 start | 4,000 rpm | 86 | 0.2 mm | 2 mm | 72.6 |
| 16 | 2 | 25 mm | 4 mm | 1 start | 4,000 rpm | 86 | 0.2 mm | 4 mm | 48.9 |
| 17 | 10 | 25 mm | 4 mm | 2 start | 3,000 rpm | 86 | 0.4 mm | 2 mm | 58.5 |
| 18 | 7 | 25 mm | 4 mm | 2 start | 4,000 rpm | 66 | 0.4 mm | 4 mm | 33.6 |
| 19 | 6 | 34 mm | 2 mm | 2 start | 4,000 rpm | 66 | 0.2 mm | 4 mm | 53.6 |
| 20 | 5 | 34 mm | 2 mm | 2 start | 3,000 rpm | 86 | 0.4 mm | 4 mm | 85.5 |
| 21 | 12 | 34 mm | 2 mm | 1 start | 4,000 rpm | 86 | 0.4 mm | 2 mm | 82.1 |
| 22 | 11 | 34 mm | 4 mm | 2 start | 3,000 rpm | 66 | 0.2 mm | 2 mm | 35.6 |
| 23 | 9 | 34 mm | 4 mm | 1 start | 4,000 rpm | 66 | 0.4 mm | 2 mm | 38.8 |
| 24 | 8 | 34 mm | 4 mm | 1 start | 3,000 rpm | 86 | 0.2 mm | 4 mm | 56.4 |
| 25 | 4 | 25 mm | 2 mm | 1 start | 3,000 rpm | 66 | 0.2 mm | 2 mm | 46.2 |
| 26 | 1 | 25 mm | 2 mm | 1 start | 3,000 rpm | 66 | 0.4 mm | 4 mm | 52.3 |
| 27 | 3 | 25 mm | 2 mm | 2 start | 4,000 rpm | 86 | 0.2 mm | 2 mm | 70.5 |
| 28 | 2 | 25 mm | 4 mm | 1 start | 4,000 rpm | 86 | 0.2 mm | 4 mm | 53.4 |
| 29 | 10 | 25 mm | 4 mm | 2 start | 3,000 rpm | 86 | 0.4 mm | 2 mm | 54.9 |
| 30 | 7 | 25 mm | 4 mm | 2 start | 4,000 rpm | 66 | 0.4 mm | 4 mm | 35.2 |
| 31 | 6 | 34 mm | 2 mm | 2 start | 4,000 rpm | 66 | 0.2 mm | 4 mm | 56.4 |
| 32 | 5 | 34 mm | 2 mm | 2 start | 3,000 rpm | 86 | 0.4 mm | 4 mm | 82.1 |
| 33 | 12 | 34 mm | 2 mm | 1 start | 4,000 rpm | 86 | 0.4 mm | 2 mm | 83.6 |
| 34 | 11 | 34 mm | 4 mm | 2 start | 3,000 rpm | 66 | 0.2 mm | 2 mm | 32.3 |
| 35 | 9 | 34 mm | 4 mm | 1 start | 4,000 rpm | 66 | 0.4 mm | 2 mm | 42.2 |
| 36 | 8 | 34 mm | 4 mm | 1 start | 3,000 rpm | 86 | 0.2 mm | 4 mm | 56.8 |
| 37 | 4 | 25 mm | 2 mm | 1 start | 3,000 rpm | 66 | 0.2 mm | 2 mm | 49.9 |
| 38 | 1 | 25 mm | 2 mm | 1 start | 3,000 rpm | 66 | 0.4 mm | 4 mm | 54.2 |
| 39 | 3 | 25 mm | 2 mm | 2 start | 4,000 rpm | 86 | 0.2 mm | 2 mm | 73.4 |
| 40 | 2 | 25 mm | 4 mm | 1 start | 4,000 rpm | 86 | 0.2 mm | 4 mm | 50.5 |
| 41 | 10 | 25 mm | 4 mm | 2 start | 3,000 rpm | 86 | 0.4 mm | 2 mm | 57.6 |
| 42 | 7 | 25 mm | 4 mm | 2 start | 4,000 rpm | 66 | 0.4 mm | 4 mm | 35.4 |
| 43 | 6 | 34 mm | 2 mm | 2 start | 4,000 rpm | 66 | 0.2 mm | 4 mm | 56.4 |
| 44 | 5 | 34 mm | 2 mm | 2 start | 3,000 rpm | 86 | 0.4 mm | 4 mm | 84.4 |
| 45 | 12 | 34 mm | 2 mm | 1 start | 4,000 rpm | 86 | 0.4 mm | 2 mm | 81.5 |
| 46 | 11 | 34 mm | 4 mm | 2 start | 3,000 rpm | 66 | 0.2 mm | 2 mm | 35.1 |
| 47 | 9 | 34 mm | 4 mm | 1 start | 4,000 rpm | 66 | 0.4 mm | 2 mm | 39.7 |
| 48 | 8 | 34 mm | 4 mm | 1 start | 3,000 rpm | 86 | 0.2 mm | 4 mm | 56.4 |
48 runs · Randomized run order · Execute in run order to guard against drift
Results & Insights
Bottom line
No. of Tufts, Tuft Diameter, Filament Diameter, and Core Diameter drive 100% of the impact you measured on Pickup. Focus improvement effort here first.
Pareto Diagram
Amber bars = significant (above crimson threshold at α = 0.05). Gray bars can't be told apart from run-to-run noise.
Main Effects
Average response at each factor setting. Steeper slope = stronger lever. Gray lines are within noise.
Analysis of the Variance (ANOVA)
| Factor | Source | Sum of squares | df | Mean square | F | p-value | % of impact | Real effect? |
|---|---|---|---|---|---|---|---|---|
| E | No. of Tufts | 6229 | 1 | 6229 | 2566 | < 0.001 | 51% | Yes |
| B | Tuft Diameter | 5068 | 1 | 5068 | 2087 | < 0.001 | 42% | Yes |
| F | Filament Diameter | 407.2 | 1 | 407.2 | 167.7 | < 0.001 | 3.4% | Yes |
| A | Core Diameter | 402.5 | 1 | 402.5 | 165.8 | < 0.001 | 3.3% | Yes |
| C | Bristle Pattern | 6.31 | 1 | 6.31 | — | — | 0.1% | Can't tell from noise |
| D | Brush RPM | 0.521 | 1 | 0.521 | — | — | 0.0% | Can't tell from noise |
| G | Carpet Penetration | 0.00330 | 1 | 0.00330 | — | — | 0.0% | Can't tell from noise |
| Error (noise) | 104.4 | 43 | 2.43 | |||||
| Total | 12211 | 47 | ||||||
α = 0.05 · average response = 55.99 · 48 runs
Four of the seven variables came back significant at 95% confidence, and the model accounts for 99.15% of the variation in pickup. That is what a well-executed experiment on a mechanical system looks like — very little noise and very clear signal.
But significant and important are different measurements, and the distance between them is the whole finding. Ranked by how much of the variation each variable actually drives:
- Number of tufts — +22.8 points of pickup, 51.4% of the variation
- Tuft diameter — −20.6 points, 41.8%
- Filament diameter — +5.8 points, 3.4%
- Core diameter — +5.8 points, 3.3%
- Bristle pattern — +0.7 points, 0.05%
- Brush RPM — +0.2 points, 0.00%
- Carpet penetration — −0.02 points, 0.00%
Two variables control the machine's performance. Tuft count and tuft diameter account for 92.5% of how the performance of the vacuum changes. More tufts is better — going from 66 to 86 adds nearly 23 points of pickup. Thinner tufts are better — dropping from 4 mm to 2 mm adds another 20. Neither is a subtle result. Together they are the difference between a vacuum that works and one that does not.
Three variables do nothing. Bristle pattern, brush RPM and carpet penetration are, between them, 0.05% of the variation. Carpet penetration was the surprising result: ask anyone how a vacuum cleans and they will describe bristles digging into the pile — it is the most confident answer in the room. Across a 2 mm change the measured effect was −0.02 percentage points: indistinguishable from zero, and invisible in a product. The intuition is not overstated. It is simply wrong. Proper factorial experimentation makes us better designers by forcing us to reckon with our conceptions about how systems behave.
Efficient factorial design does not care what anyone believed, and the results say so plainly — when a variable everyone was sure about has nothing to contribute, it settles the argument quickly. It also makes the product better, because it shows where the design is free: RPM and penetration can now be set for noise, wear or motor cost instead of for performance.
A fourth variable was kept for a reason the statistics could not supply. Core diameter moves pickup by 5.8 points — 3.3% of the variation, a rounding error beside tuft count. The team carried it into the optimization stage anyway, because the core is the most expensive part of the roller assembly and its diameter drives that cost directly. A variable that barely moves performance but strongly moves cost is exactly the lever you want available when the goal becomes performance per dollar, and dropping it here would have meant discovering that one stage too late. Filament diameter — its statistical twin at 3.4% — was set aside instead: bristle stock is a supplier decision with long lead times, while core diameter is a molding change the team controls.
This is where the statistics stop and the engineering starts. Taguchi experiments rank the variables, but it still takes a team to decide which ones to chase for reasons other than statistics — that call belonged to the people who knew which change could reach the market first. What the experiment gave them was real, actionable results they could act on.
One thing the analysis deliberately cannot tell you: with a screening array, interactions between variables are left unresolved. The team accepted that on the way in and settled it in the follow-up, where three variables and a complete factorial made the question answerable — and where the cost of each variable finally entered the picture. That study is Maximum Cleaning Power, Minimum Cost.
Key Takeaways
- Screening is a different job from optimizing — twelve configurations against 128 is not a cheaper version of the same experiment. Taguchi designs help designers answer a narrower question: which variables deserve the most attention.
- Significance and importance are not the same measurement — all four surviving variables are statistically significant (p < 0.05), yet only two variables carried 92.5% of the changes in performance.
- The most confident intuition was the wrong one — the mechanism most people named first, carpet penetration, only moved the response by 0.02 points. Factorial experiments allow the system being studied to tell us what matters, rather than the other way around.
- Variables that do nothing are an opportunity, not a failure — three dead variables are three fewer constraints, now free to be set for cost, noise or durability.
- Replicate when runs are cheap — four repeats per configuration bought the precision to separate a 5.8-point effect from a 0.7-point one with confidence.
- When the statistics tie, the decision is yours — two variables of identical measured value, separated only by which one the team could actually change this quarter.
Source. Allen, P. (2020). Design of Experiments for 21st Century Engineers. Lulu.com. ISBN 978-0-244-58450-4, p. 62–71. The Blueprint recreation, the analysis framing and the plain-English reading of the results are original WIS work.