Overview
The injection molding area of a manufacturing plant had been running scrap and rework at a record 12% for two consecutive quarters. The downstream assembly line traced the rejections to excessive shrinkage in some of the parts.
Quality improvement engineers identified six variables suspected of contributing to excess shrinkage, and therefore to the fitment failures. Testing all six properly would take every combination of two settings each — 2⁶ = 64 runs — and that much testing time meant substantial capacity reduction and lost revenue. The experiment had to be as efficient as possible.
With these constraints in mind (6 variables, minimal downtime) the team decided to run a structured experiment allowing them to test a quarter-fraction of the full design: 16 runs. The experiment found what they were looking for. It also found something they were not.
Averages hide variation. In this case study, two variables set the part size and a third variable controlled the consistency. Nothing in the average response would have found it, but a structured experiment did.
Every process has a variable like this. Finding it takes an experiment designed to look at the spread and not just the average — which is the one thing chasing a setpoint (by adjusting one knob at a time) can never do.
The Challenge
Dimensional shrinkage is unavoidable in injection-molded thermoplastics: the resin contracts as it cools, and how much it contracts depends on temperature, pressure, timing, tooling geometry and a dozen other things that move at once in a live plant.
The assembly line complaint was part fitment. The team's interpretation of that complaint was average shrinkage is wrong, and so every corrective action was a setpoint change: nudge the mold temperature, re-tune the pack pressure, hold a little longer. Sometimes yield improved. More often it didn't, or it improved for a shift and reverted.
That interpretation was the real problem. A part that shrinks 3% every single time can be designed around — oversize the tool by 3% and the problem is solved forever. However, a part that shrinks 3% on average while the shrinkage on any given shot wanders between 0.4% and 6% is a problem that examination and intuition will not catch.
The team agreed to study six plausible variables affecting part shrinkage, lettered here as they appear on the machine schematic below:
- Mold temperature (A) — how hot the tool itself is held while the part cools in the cavity.
- Screw speed (B) — how fast the screw turns while it melts and meters the next shot.
- Holding time (C) — how long the part stays under pressure in the cavity before ejection.
- Cycle time (D) — the total time per shot, mold close to eject.
- Gate size (E) — the opening the melt passes through on its way into the cavity.
- Hold pressure (F) — how hard the screw pushes on the melt cushion after the cavity fills.
Testing every combination of six variables takes 64 runs. On a production press, in a plant already running at 12% scrap, an experiment that large is difficult to approve.
The assembly line needed both questions answered: 1) what was driving the average shrinkage per part, and 2) why the parts were so inconsistent with each other. Those are two different engineering problems and they have two different answers. A single, properly structured experiment answered both.
The Experimental Approach
Getting six variables into 16 runs is exactly what a fractional factorial design is for. The idea is not to guess which variables to leave out — it is to test all six, and accept a specific, known ambiguity in the answer in exchange for running a quarter of the work. By understanding the design limitations upfront (during the design phase), quality teams can make an informed tradeoff that balances downtime against expected results. This kind of assessment helps teams communicate clearly and creates a collective sense of ownership in the outcome.
The trade here is specific and worth naming: in a design this size, some two-variable interactions are tangled together and cannot be told apart. The point of choosing this kind of design deliberately is that you obtain just the right amount of information to answer a specific set of questions — and you know going in which question you have left open, so you can check afterwards whether it mattered. In this experiment it did not: only two variables and the interaction between them turned out to be active, and nothing they were tangled with was in play.
Before the design comes the cause analysis: everything that could plausibly move shrinkage, sorted, and each one labeled.
The C list is the one people skip. If a variable is neither tested nor written down, it is free to move during the experiment — and when the results don't repeat six months later, nobody can say why.
Six causes were labeled as variables to be studied:
- Mold temperature (30°C / 60°C) — the tool, not the melt. The team's standing hypothesis and the setpoint they had been adjusting for months.
- Screw speed (75 / 150 rpm) — governs shear and melt history, and drifts between setups without being logged.
- Holding time (8 / 16 s) — included because nobody could agree whether eight seconds was already more than enough.
- Cycle time (30 / 40 s) — the throughput lever, included because if it turned out not to matter the plant could run faster for free.
- Gate size (1.0 / 2.0 mm) — a tooling change, expensive to get wrong.
- Hold pressure (350 / 700 bar) — routinely adjusted for cosmetic finish without anyone tracking the dimensional consequence.
Inputs · variables tested
Mold Temperature
30°C → 60°C
Screw Speed
75 rpm → 150 rpm
Holding Time
8 s → 16 s
Cycle Time
30 s → 40 s
Gate Size
1.0 mm → 2.0 mm
Hold Pressure
350 bar → 700 bar
Process
Part shrinkage
Outputs · what we measured
Response
Shrinkage [×10⁻³ cm/cm]
Held constant
| Factor | How it was controlled |
|---|---|
| Cooling water temperature | Chiller locked at 12°C |
| Resin moisture | Dried 4 hr at 80°C before each run |
| Material lot | Single lot purchased for full experiment |
| Ambient temperature | HVAC locked 22 ± 1°C |
| Barrel temperature profile | Calibrated before experiment; monitored each run |
| Caliper calibration | Calibrated per NIST traceable standard |
The Design
Sixteen runs, executed in randomized order across a single shift, with shrinkage measured at a fixed reference point on each part after the part has reached steady-state room temperature.
| Run | Std | Mold Temperature(°C) | Screw Speed(rpm) | Holding Time(s) | Cycle Time(s) | Gate Size(mm) | Hold Pressure(bar) | Shrinkage[×10⁻³ cm/cm] |
|---|---|---|---|---|---|---|---|---|
| 1 | 12 | 60°C | 150 rpm | 8 s | 40 s | 1.0 mm | 350 bar | 60 |
| 2 | 6 | 60°C | 75 rpm | 16 s | 30 s | 1.0 mm | 700 bar | 15 |
| 3 | 2 | 60°C | 75 rpm | 8 s | 30 s | 2.0 mm | 350 bar | 10 |
| 4 | 16 | 60°C | 150 rpm | 16 s | 40 s | 2.0 mm | 700 bar | 52 |
| 5 | 10 | 60°C | 75 rpm | 8 s | 40 s | 2.0 mm | 700 bar | 12 |
| 6 | 7 | 30°C | 150 rpm | 16 s | 30 s | 1.0 mm | 350 bar | 26 |
| 7 | 9 | 30°C | 75 rpm | 8 s | 40 s | 1.0 mm | 700 bar | 8 |
| 8 | 1 | 30°C | 75 rpm | 8 s | 30 s | 1.0 mm | 350 bar | 6 |
| 9 | 3 | 30°C | 150 rpm | 8 s | 30 s | 2.0 mm | 700 bar | 32 |
| 10 | 15 | 30°C | 150 rpm | 16 s | 40 s | 1.0 mm | 700 bar | 37 |
| 11 | 11 | 30°C | 150 rpm | 8 s | 40 s | 2.0 mm | 350 bar | 34 |
| 12 | 4 | 60°C | 150 rpm | 8 s | 30 s | 1.0 mm | 700 bar | 60 |
| 13 | 5 | 30°C | 75 rpm | 16 s | 30 s | 2.0 mm | 700 bar | 4 |
| 14 | 14 | 60°C | 75 rpm | 16 s | 40 s | 1.0 mm | 350 bar | 5 |
| 15 | 13 | 30°C | 75 rpm | 16 s | 40 s | 2.0 mm | 350 bar | 16 |
| 16 | 8 | 60°C | 150 rpm | 16 s | 30 s | 2.0 mm | 350 bar | 60 |
16 runs · Randomized run order · Execute in run order to guard against drift
Sixteen of the 64 possible combinations were chosen so that every variable is tested at both of its settings an equal number of times and no variable is accidentally tangled with another on its own. That design balance is the whole trick: fractional factorial experiments help answer in 16 runs what would have otherwise taken 64.
Results & Insights
Sixteen runs produce fifteen effect estimates — the six variables, and the ways they could combine. Three of those fifteen are real. Together they account for 96% of everything that moved.
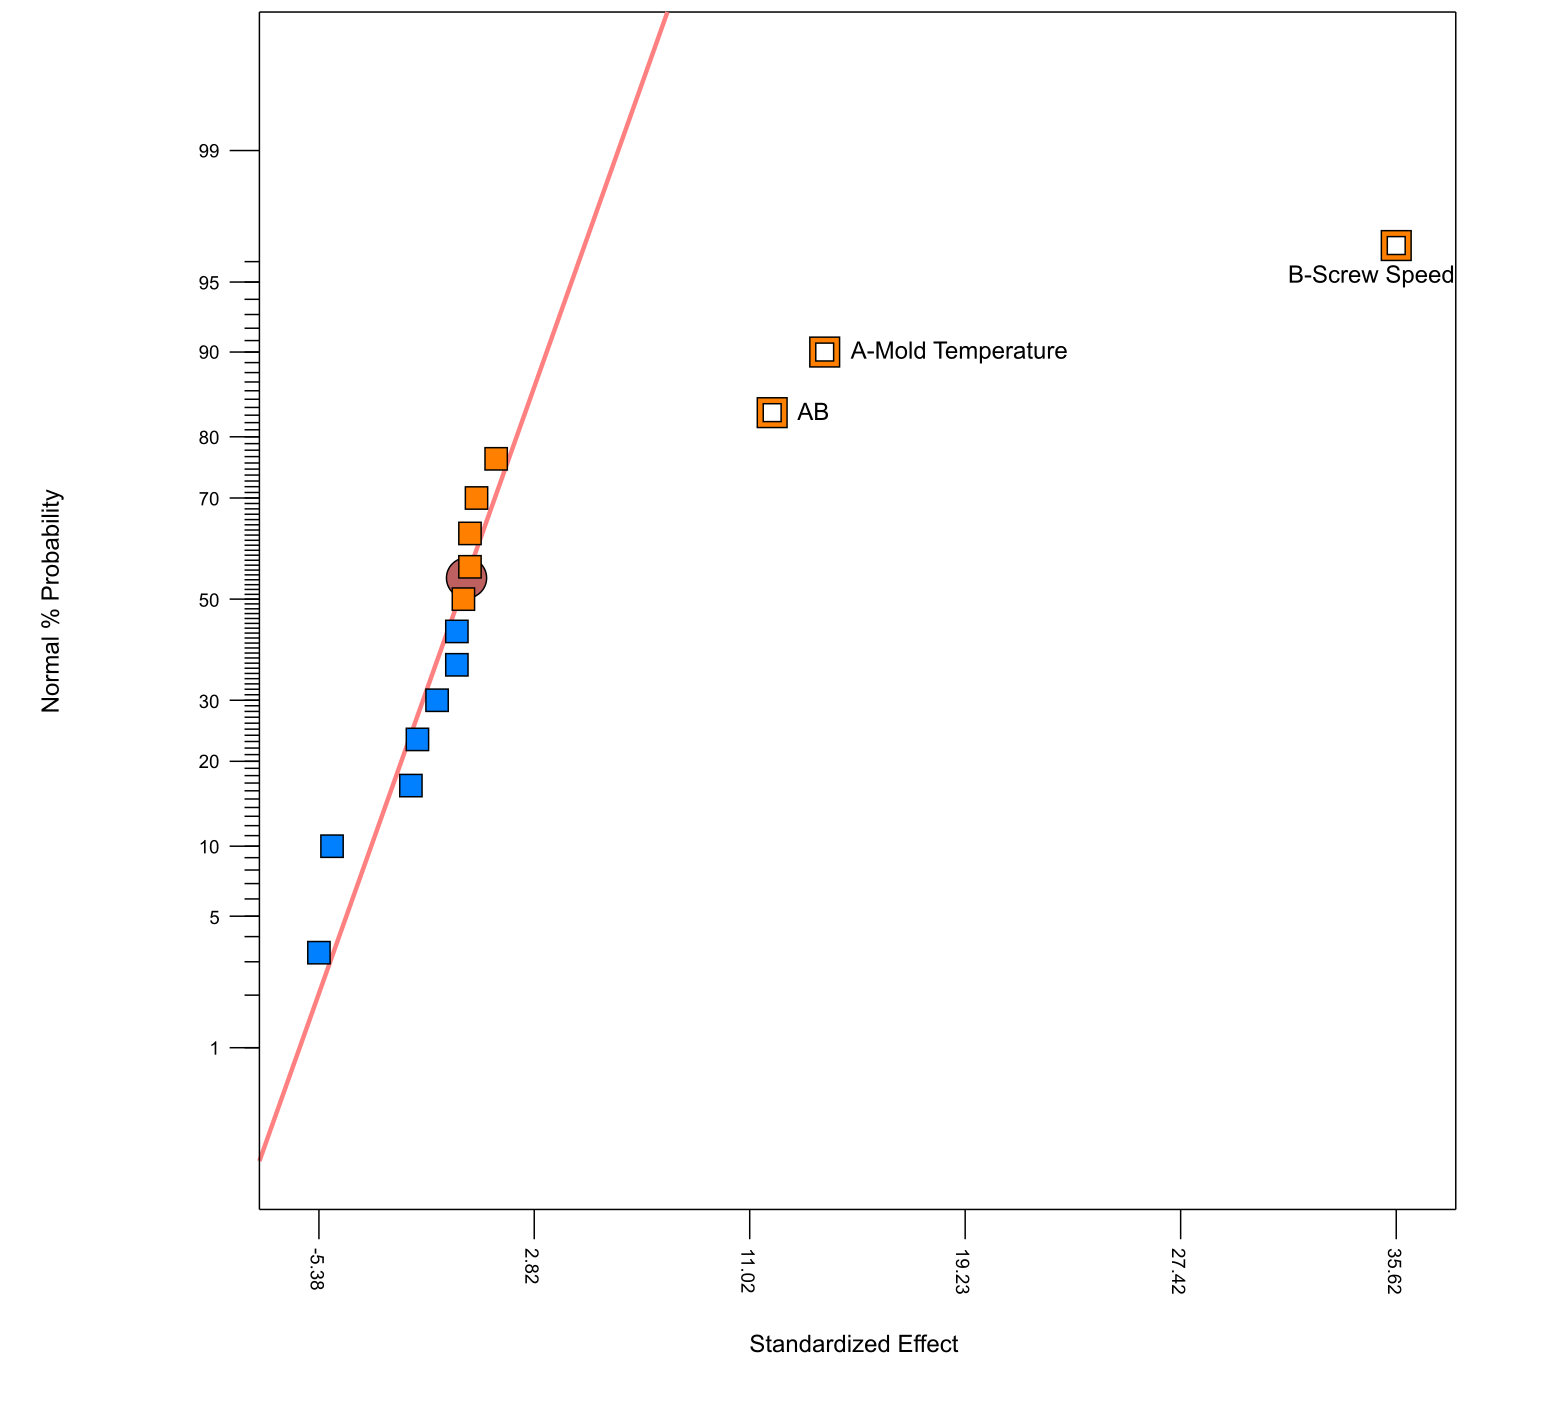
The twelve points sitting on the red line of Figure 2 are the system telling you that twelve of the things you measured did not change part shrinkage. That is an important result, not a gap. The three that sit off the red line do shift the average response, and they are the ones worth investigating further.
Screw speed is the dominant lever by far: an effect of 35.6 units, or 76% of the variation.
Mold temperature — the variable the plant had been adjusting all along — is real at 13.9 units, or 12% of the variation. As often happens, adjusting a known variable was not wrong. It was just incomplete.
The third one is the interaction between them, and it is the reason two quarters of temperature trials contradicted each other.
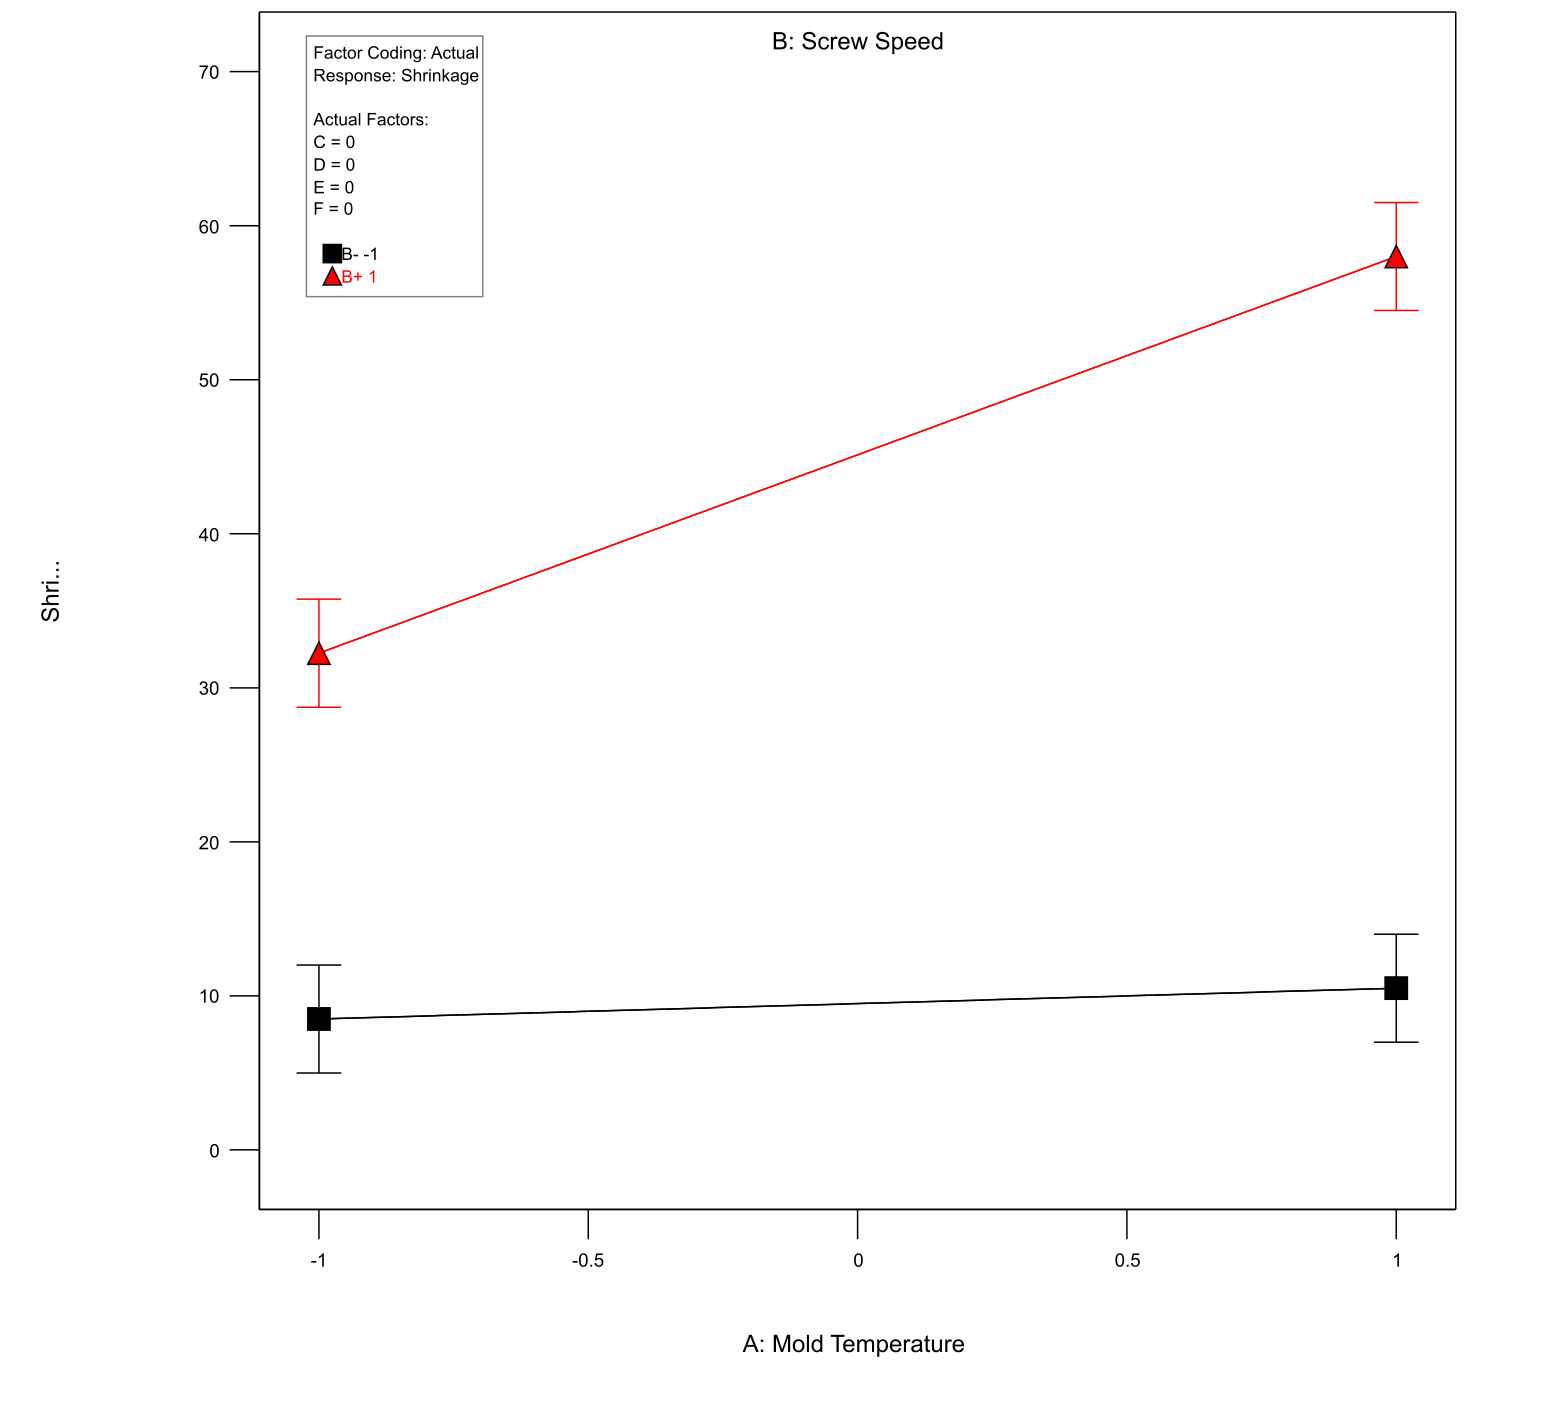
Read the two lines separately in Figure 3 and the problem reveals itself: at the low screw speed (bottom line), moving mold temperature from one end of its range to the other changes shrinkage by only two points — likely not noticeable on a scrap report. At the high screw speed (top line), the identical change moves it by twenty-six. That is 13× the effect from the same adjustment.
Every temperature trial the plant ran was honestly measured and quietly wrong, because the answer depended on a second variable nobody was holding still. This is precisely what a factorial design sees and what changing one thing at a time structurally cannot.
The table below puts numbers on all of it. An analysis of variance asks one question of every candidate: is this bigger than the run-to-run noise? The percentages are each variable's share of everything that moved, the p-value is how often noise alone would throw up an effect that large, and anything the analysis cannot separate from noise is pooled into the error term and reported as exactly that.
Bottom line
Screw Speed + Mold Temperature — plus interactions between your factors — together drive 96% of the impact you measured on Shrinkage.
Pareto Diagram
Amber bars = significant (above crimson threshold at α = 0.05). Gray bars can't be told apart from run-to-run noise.
Main Effects
Average response at each factor setting. Steeper slope = stronger lever. Gray lines are within noise.
Analysis of the Variance (ANOVA)
| Factor | Source | Sum of squares | df | Mean square | F | p-value | % of impact | Real effect? |
|---|---|---|---|---|---|---|---|---|
| B | Screw Speed | 5077 | 1 | 5077 | 244.9 | < 0.001 | 76% | Yes |
| A | Mold Temperature | 770.1 | 1 | 770.1 | 37.15 | < 0.001 | 12% | Yes |
| A×B | Mold Temp × Screw Speed | 564.1 | 1 | 564.1 | 27.21 | < 0.001 | 8.5% | Yes |
| A×D | Mold Temp × Cycle Time | 115.6 | 1 | 115.6 | — | — | 1.7% | Can't tell from noise |
| A×B×F | Mold Temp × Screw × Press | 95.06 | 1 | 95.06 | — | — | 1.4% | Can't tell from noise |
| A×E | Mold Temp × Gate Size | 14.06 | 1 | 14.06 | — | — | 0.2% | Can't tell from noise |
| A×C | Mold Temp × Holding Time | 10.56 | 1 | 10.56 | — | — | 0.2% | Can't tell from noise |
| D | Cycle Time | 7.56 | 1 | 7.56 | — | — | 0.1% | Can't tell from noise |
| C | Holding Time | 3.06 | 1 | 3.06 | — | — | 0.0% | Can't tell from noise |
| A×F | Mold Temp × Hold Pressure | 1.56 | 1 | 1.56 | — | — | 0.0% | Can't tell from noise |
| F | Hold Pressure | 0.563 | 1 | 0.563 | — | — | 0.0% | Can't tell from noise |
| E | Gate Size | 0.563 | 1 | 0.563 | — | — | 0.0% | Can't tell from noise |
| A×B×D | Mold Temp × Screw × Cycle | 0.0625 | 1 | 0.0625 | — | — | 0.0% | Can't tell from noise |
| B×F | Screw Sp × Hold Pressure | 0.0625 | 1 | 0.0625 | — | — | 0.0% | Can't tell from noise |
| B×D | Screw Speed × Cycle Time | 0.0625 | 1 | 0.0625 | — | — | 0.0% | Can't tell from noise |
| Error (noise) | 248.8 | 12 | 20.73 | |||||
| Total | 6659 | 15 | ||||||
α = 0.05 · average response = 27.31 · 16 runs
The negative results are worth as much as the positive ones — here's how:
Cycle time — it does not affect the average, so it can be cut to its low setting and the press simply runs more parts per shift.
Gate size — no effect on average part size either, so it can be chosen for melt flow or tool life instead. A real win for machine reliability.
Hold pressure — also no effect on the average response, so it can go back to being a cosmetic control. A win for finish quality.
The value of this cannot be overstated. Three variables that did not affect the average can now be optimized for business value beyond shrinkage — set for tool reliability, part quality and throughput instead. And the decisions are made on evidence, which lets decision-makers optimize the business in real, defensible ways.
The Unexpected Finding That Wasn't in the Model
Holding time has no effect on average shrinkage. Its main effect is 0.88 units against screw speed's 35.6 — statistically and practically nothing. On a conventional read of the analysis, it is a variable you would set to whatever is convenient and stop thinking about.
Look at what the original model couldn't explain, sorted by holding time, and it turns into the most important variable in the study.
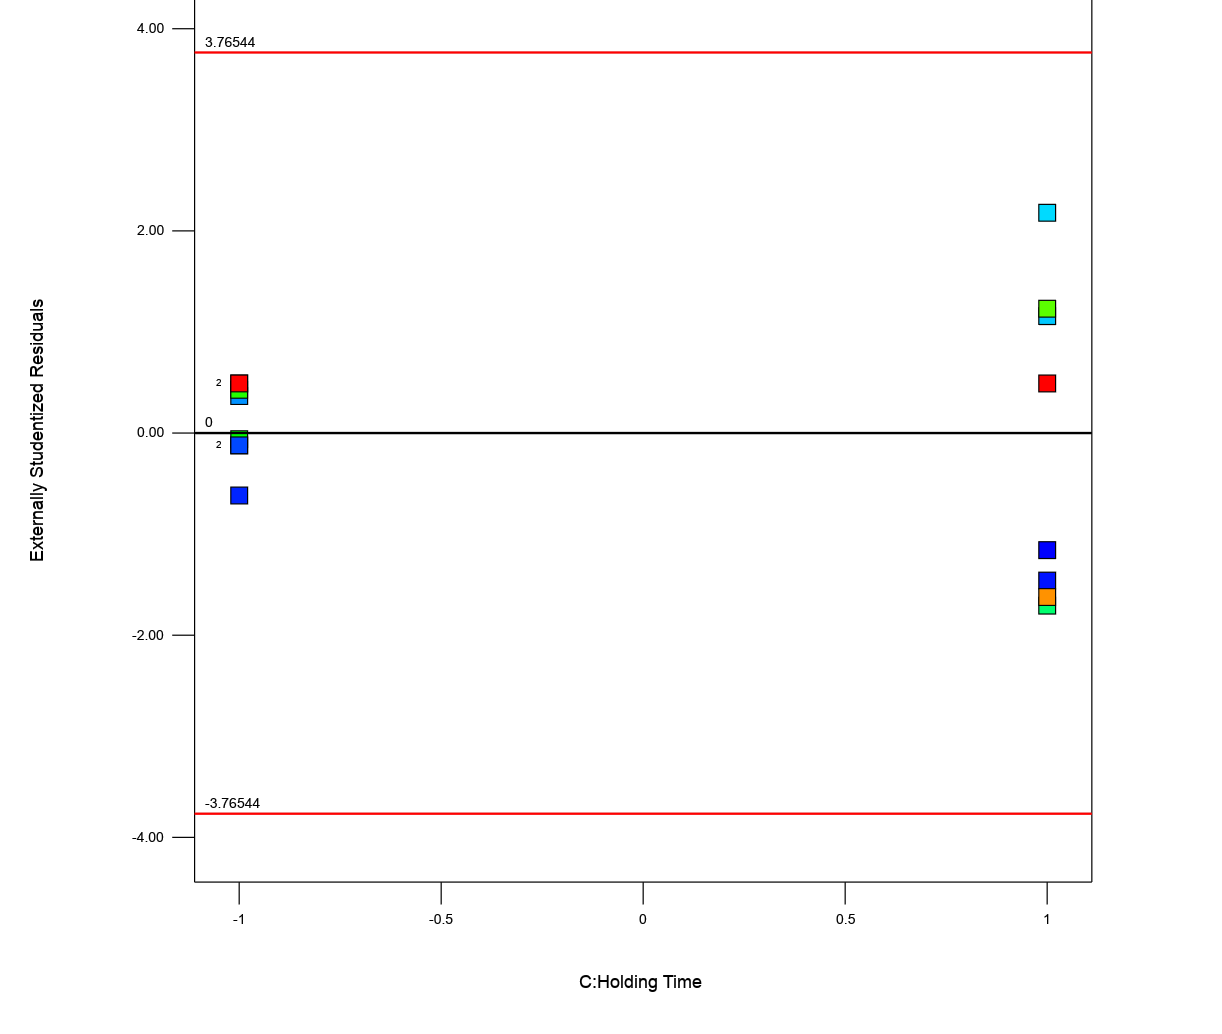
Figure 4 shows the run-to-run variation at 16 seconds is twelve times the variation at 8 seconds. You can see it without any statistics at all by reading four rows off the design table. Four runs share the low-shrinkage corner — mold temperature low, screw speed low — and differ only in variables that do nothing. The two run at eight seconds came back 6 and 8. The two run at sixteen seconds came back 4 and 16.
Same average. Utterly different products.
This is what the plant was actually shipping, and it is why two quarters of setpoint changes went nowhere. Every one of those adjustments moved the center of the distribution. Not one of them touched its width — and the width (variation in the part shrinkage) was the real culprit.
The customer never asked for a different average. They asked for the same part twice. The experiment found the knob for that, and it was on a variable the analysis had already dismissed.
The recommendation writes itself, and it uses every one of the six variables: screw speed and mold temperature to their low settings, which puts average shrinkage where it belongs; holding time to 8 seconds, which is what buys the consistency; and cycle time, gate size and hold pressure freed for throughput, tooling life and finish, because the experiment showed they cost nothing dimensionally. All decided in sixteen runs, one shift, minimal downtime.
Key Takeaways
- The average and the spread are two different problems. A part that shrinks the same amount every time can be designed around. One that averages correctly and wanders cannot. Two quarters of setpoint changes went nowhere because every one of them was aimed at the average.
- One variable decided consistency without touching the average. Holding time moved mean shrinkage by less than a point and changed run-to-run variation twelve-fold. Nothing in a standard results table flags that — you find it only if you go looking.
- Negative results matter as much as positive ones. Cycle time, gate size and hold pressure were statistically cleared of any effect on shrinkage, which frees all three to be optimized for throughput, tool life and finish.
- Sixteen runs settled what two quarters of adjustments could not — one shift on one press, against two quarters of guessing at 12% scrap.
Source. Montgomery, D.C. (2017). Design and Analysis of Experiments, 10th ed. Wiley. ISBN 978-1-119-72210-6, Example 8.4, p. 292. Every shrinkage value and the whole design matrix are the original; the source publishes coded factor levels only, so the engineering settings are ours. The Blueprint recreation, the analysis framing and the plain-English reading of the results are original WIS work.